
Hi there AppWorks fans,
Welcome to a new installment of AppWorks tips.
This week we’re going to consume the Google Charts API which makes it possible to create fancy charts and data graphics…How nice would it be if the input data would be retrieved from our own entity data!? This post will bring you to that track where we build a nice dashboard for all the managers who are interested in this type of information. Hard to do? We’ll see…
Let’s get right into it…
We start with the question: How to start with this post? Well, start small by first creating 1 charts and extend it to multiple charts…duh? Ok, but from where are we going to call the ‘Google Charts API’ and how are we injecting the data from our entity data? Finally, how do we craft a fancy report dashboard?
All great questions and if you followed all my blogs you probably have an answer also, but this would be my approach:
- The API is an external thing, so we need to call it externally…For this to happen we learned to use a ‘Web Content’ panel on a layout!
- A ‘Web Content’ panel requires some input…from?…Yes…A webpage!…So, just an HTML document with some tags/scripts
- The HTML document must be reachable from our webserver…For this we use a ‘Web Library Definition’…Like we normally do for all ‘assets’ in our solution.
- When the above bullets are ready, we extend the layout to a ‘Homepage’ layout with the great name ‘Reporting Dashboard’ where we add multiple ‘Web Content’ panels that point to different HTML documents
With this list in mind…We start with our VM startup, and we jump right into our project where I start with a basic folder structure like this one in my ‘generic’ project:
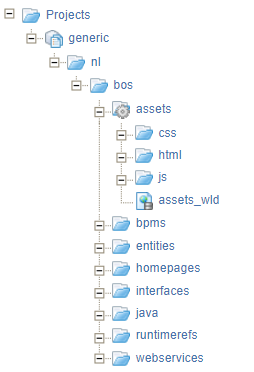
You see already some preparation for the ‘assets’ folder. This first thing is to set the ‘assets’ folder as ‘Start Point Of Qualified Name’ (right-click context menu). You know why?…correct?…If not…Check this post.
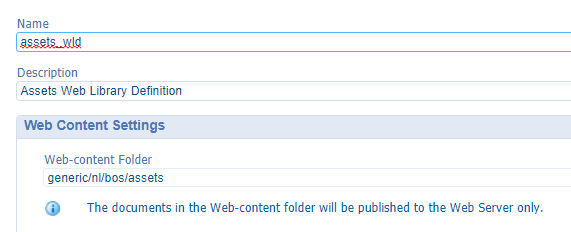
This is a screenshot of my ‘Web Library definition’ with the great name ‘assets_wld’:
Initial set-up ready…next…
Our first HTML page (in a layout)
Dive into the ‘html’ folder under the ‘assets’ folder where we create our first document of type ‘HyperText Markup Language’ with basic content which looks like this:
1 |
|
As this page falls in the ‘Web Library Definition’ it will be available in runtime after the page publication…The URL should look like this:http://192.168.56.107:8080/home/appworks_tips/html/charts.htm
Our first step in the correct direction…Let’s place this content into our first layout…A “homepage” layout!
Back in our project we create such a new document (of type ‘Home Page Layout’) nicely in the ‘homepages’ folder…I gave it these properties with this ‘Header image’ of size 445px x 31px. I uploaded the image in my project in an ‘images’ folder under the ‘assets’ folder (so it gets published with the rest)!

Let’s do some ‘Configuration’ on our homepage with the corresponding blue ‘Configure’ button…
We only drop a ‘Web Content’ panel in the middle, and we make sure to point to our HTML with this URL: /home/appworks_tips/html/charts.htm
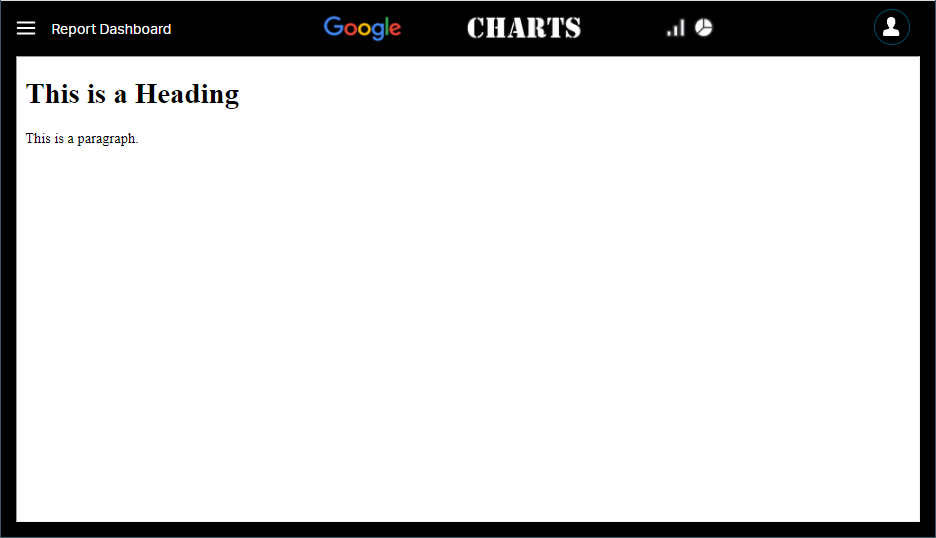
A first draft version after publication of the homepage and the ‘assets’ folder (or the whole project):
I cheated a bit by creating a theme document that masks everything in black. A theme created in a ‘theme’ folder…Simple and efficient…You probably figure that one out yourself…If not? Leave it in the comments!
Great…next step…
The craftsmanship of calling the charts API
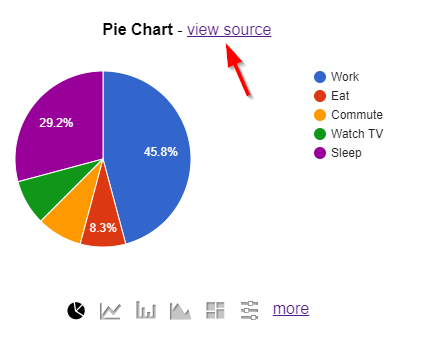
For this step we first have a dive into the API…Sounds hard but is pretty simple. On the main page you see on the top right several charts passing by…Just hit the ‘Pie-chart’ to view its source:
You should be able to copy some code which looks like this (I modified it a bit to fit it into my page):
1 |
|
Copy this content into the ‘charts.htm’ document and after a publication, and some browser-cache cleaning you should be able to accomplish a screenshot like this one:

Who, hooo…We’re getting somewhere…Next!
Retrieve entity data into our HTML page
Time to retrieve some entity data, but to make this step work we first need an entity with some exposed webservice operations.
Our ‘case’ entity will look like this (just some different typed properties to play around with):
| Label | Name | Type |
|---|---|---|
| Name | case_name | Text |
| Status | case_status | Enumerated text |
| Is active | case_is_active | Boolean |
| Budget | case_budget | Currency |
| Start date | case_start_date | Date |
Make it as fancy as you like…After the generation of the default BBs I did these type of standard updates:
- Add a ‘Display name’ on the entity properties (button next to the ‘Refresh’)
- Label the ‘DefaultList’ to ‘All cases’
- Add the ‘Title’ BB with expression
item.Properties.case_name - Select a currency for the ‘Budget’ property
- Add labels to the ‘Is active’ property (and remove the ‘none’ option)
- Add some nice values for the enumerated text ‘Status’ property (we can also use a lifecycle, but this is faster for now!)
- Create an event ‘Rule’ BB with the name ‘e_on_init_set_start_date’ which ‘on item initialization’ will set the ‘Start date’ to value
today - Layout the ‘Create’ form, so you see nice dropdowns, checkboxes…etc.
After publishing, you should be able to add a new case (a bit) like this:

Next step to take is exposing the webservices for this entity! For 2 reasons…1. For generating test ‘case’ instances (with a ‘Create’ operation); 2. For reading all the cases with a ‘Find’ operation.
My ‘Web service’ BB looks like this (with nothing special behind the ‘all_cases’ operation!)
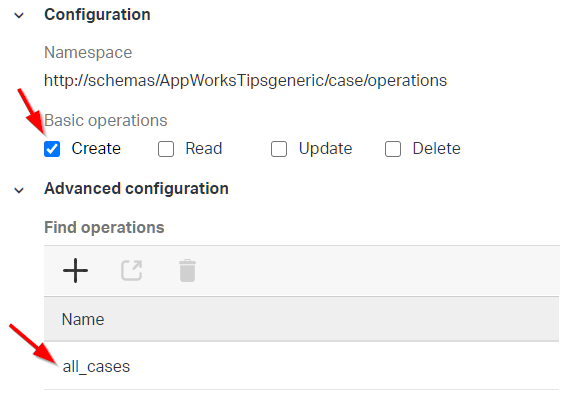
Great…save and publish!
No testing (yet) as we all know (by now) we also need to create a ‘Webserver’ service container (aka ‘Application Server Connector’), so our AppWorks Gateway ‘knows’ who can handle these SOAP service requests…Do a search on this site where you can find plenty of examples on how to make this step work for you.
I assume you have the service container (connected to the ‘Application Server’) up and running, and the webservice interface for this entity connected…!?
Time for some testing…With the ‘Webservice interface explorer’ artifact. The search for ‘case’ will expose our 2 service operations:
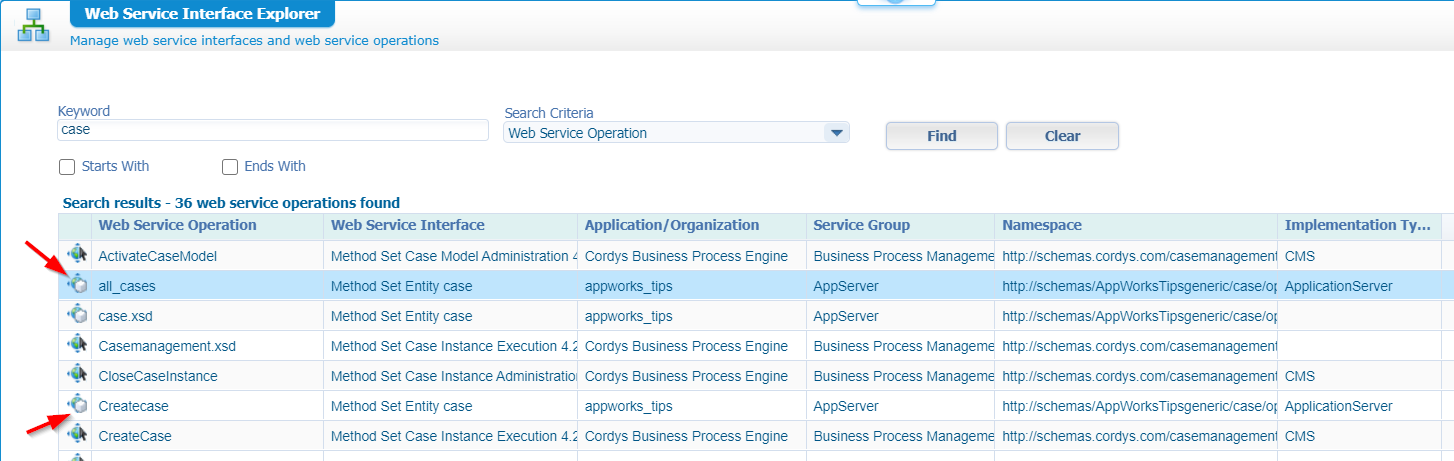
A test request for ‘all_cases’ will look like this:
1 | <SOAP:Envelope xmlns:SOAP="http://schemas.xmlsoap.org/soap/envelope/"> |
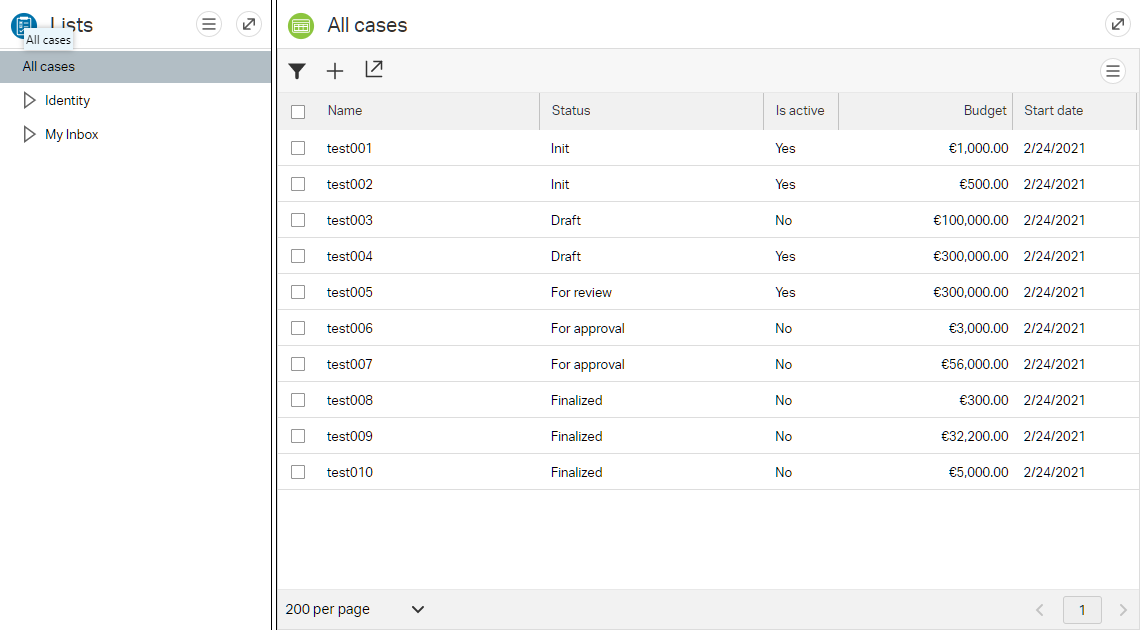
It will return with all currently created ‘case’ instances in runtime…In my example just one (for now!)
Next is the creation of a new ‘case’ instance…With a request like this one:
1 | <SOAP:Envelope xmlns:SOAP="http://schemas.xmlsoap.org/soap/envelope/"> |
So, in this way you should be pretty fast to generate some runtime data like this:
You can even make it more fancy with more Rules that make it more dynamic. A nice thing to build is a BPM for-loop which reads XML data as input to generate a set of test data like this, but that’s another post on my backlog…great stuff!
Ok, back on track after a short coffee break…☕
…
Let’s first do some file separation where our ‘charts.htm’ imports a ‘charts.js’ JavaScript like this (with also the other HTML5 SDK scripts!):
1 |
|
This will be our ‘charts.js’ which is created in the ‘js’ folder of our ‘assets’!
1 | google.charts.load('current', {'packages':['corechart']}); |
For our first attempt to retrieve entity data we place this script in the drawChart() method:
1 | $.cordys.ajax({ |
We learned about this piece of script already in the HTML5 SDK post linked above!
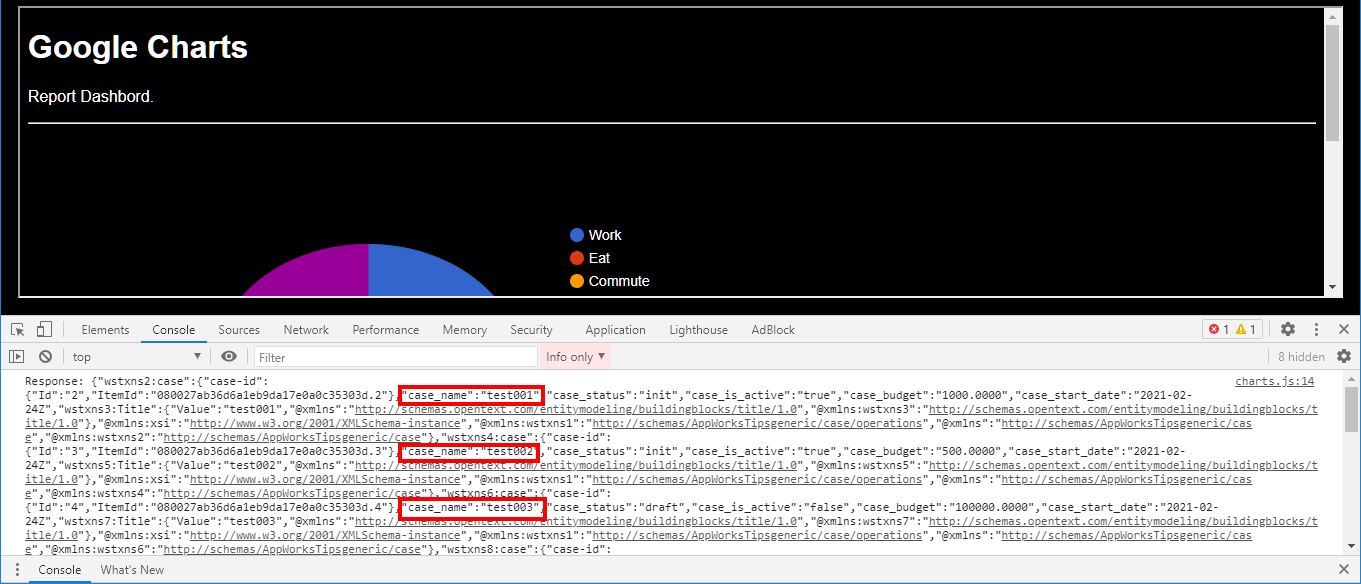
After a publication and refresh in runtime we should clearly see some result in our developer console which looks like this:
Great stuff!!!….Hooray…Time for our next step…Do you also feel the excitement!? 😁
Glue it all together
Well, I can write it all down, but let’s just share the JavaScript code, so you see what happens in the successFunction() method:
1 | //Load the Google chart API |
Focus areas:
- The correct namespace and operation name for the SOAP call
- Learn jQuery
- Hire a JavaScript developer (as I know how it works, but a dedicated JavaScript developer can make it even nicer!). Getting the unique states and the count per state took some time in the example.
- Learn the Google Charts API. Not hard to do as even I can make it work!? Styling the chart took some time.
- Comment your code for clarification…As a good developer does! 😇
The end-result?
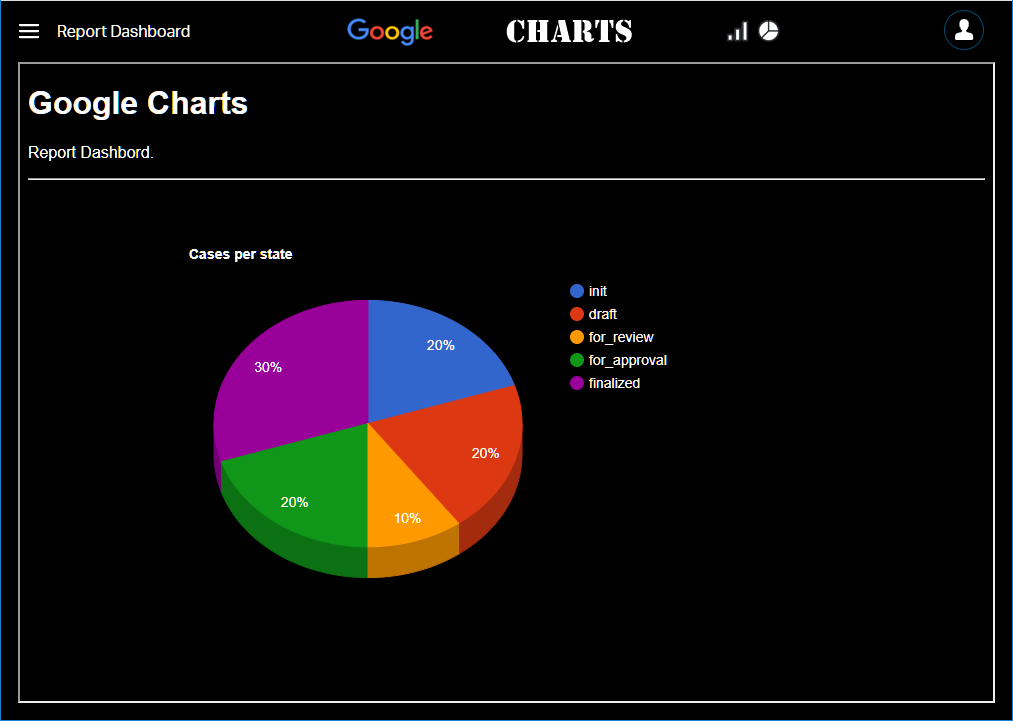
The extension to a real ‘Reporting Dashboard’
Well, now we have this chart ready…It’s time to add more…So, what else?
First we extend our homepage with more ‘Web content’ panels like this where we point to our charts.htm for each of them.

You probably can guess what will happen in runtime after a publication!?
…
A couple or hours later……….A check on my end result!!
…
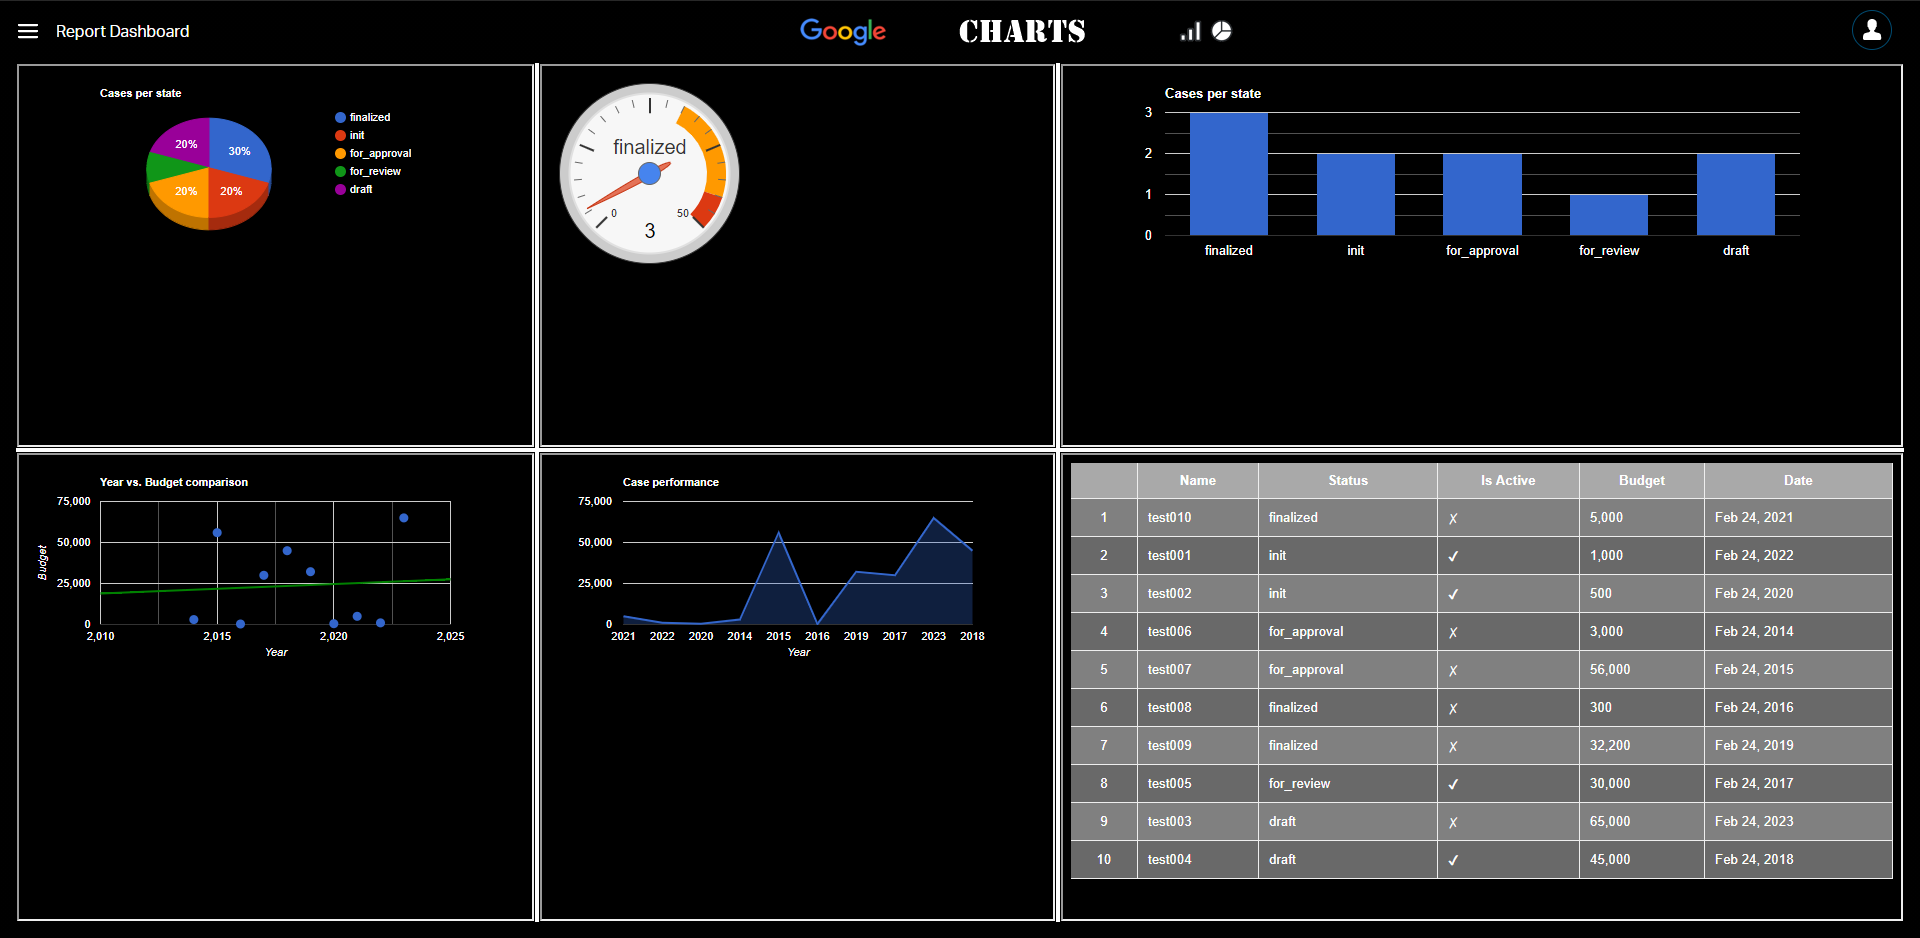
How nice…Download my ‘assets’ folder from here to check it all yourself!
Again a “DONE” for this Google charts API post…Great stuff to use in the future, and great stuff to play around with. We learned about calling the Google charts API and how to integrate it with our valuable entity data create on our beloved platform. We also experienced the requirement of JavaScript knowledge, but if you are a continuous learner like I am you will also get a grip on this programming language and get better by the time! See you in the next great post…Have a good week-end!
Don’t forget to subscribe to get updates on the activities happening on this site. Have you noticed the quiz where you find out if you are also “The AppWorks guy”?
