
Hi there “Process Automation” fans,
Welcome to a new installment of “Process Automation” tips.
When end-users start to complain about performance, you can raise a #RED_FLAG (🚩) within your project team. Performance is a problem with a wide variety of techniques to search for. It’s mostly not one thing which is going slow; the runtime UI gets the fault first which directly hits the solution craftsmanship. However, it can also be a database issue, an OS issue, a network issue, a firewall, virus-scanner, or SSL-connection issue…AND whatever else that could be slow. It drops in silently (like the last drop of water floating out a full bucket of water) and end-users accept it till a certain level. When the UI is loading slowly with end-less rotating loading icons it’s time for action. This post tells you about three things to first search for in the UI of the end-user…
Be aware that “Case management” does not equal a quick Google search. The UI needs to digest large datasets and communicates heavily with external systems (like xECM, OTDS, Documentum, SAP, HR-system, or any other). This all takes time on itself and is acceptable. To keep track of performance, it’s key to make a zero-measurement on a clean system and run a performance measurement after each deployment of your solution to track down any slowness in the UI.
…
“Measuring is knowing, and seeing is believing”!
Let’s get right into it…
I have my VM already up and running with a solid case management solution in place including all the parts to manage cases. In runtime, you can open the developer tools (<F12> in Chrome) where we can check different topics when it gets to performance measurement.
For this post we’ll do the measurement manually, but all this information is automatable (is that a word!?).
Before you start with the developer tools, put these settings in place:
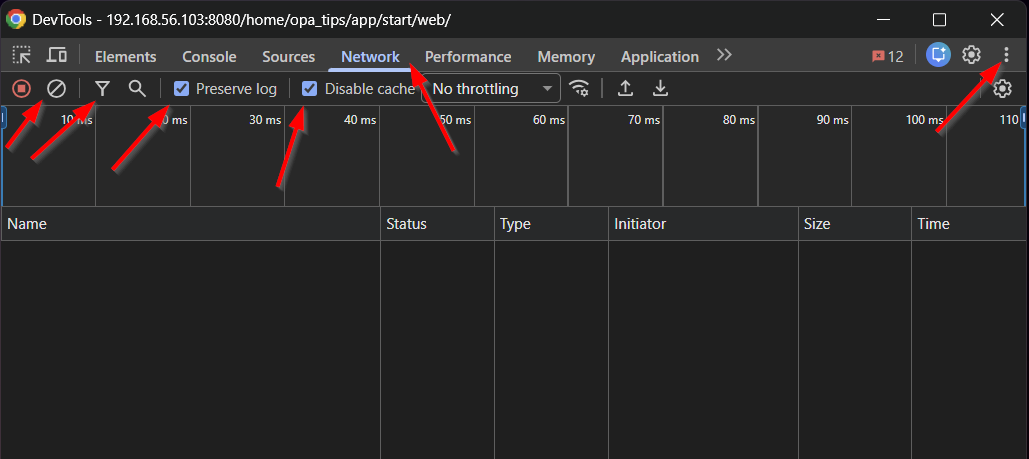
From left to right:
- Clear the list at the bottom…We’ll fill it with data later
- Filter out specific calls (we don’t need it for now)
- ‘Preserve log’ makes it possible to jump from screen to screen without losing history calls
- ‘Disable cache’ works like the incognito tab
- ‘Network’ tab will show you all the network traffic of your page loadings
- At the end, you’ll find an option to run this in a separate window (handy, if you’re on a large 4K screen)
We don’t have traffic yet, so you can hit the ‘Reload page’ option or just refresh the current page to start the network traffic…
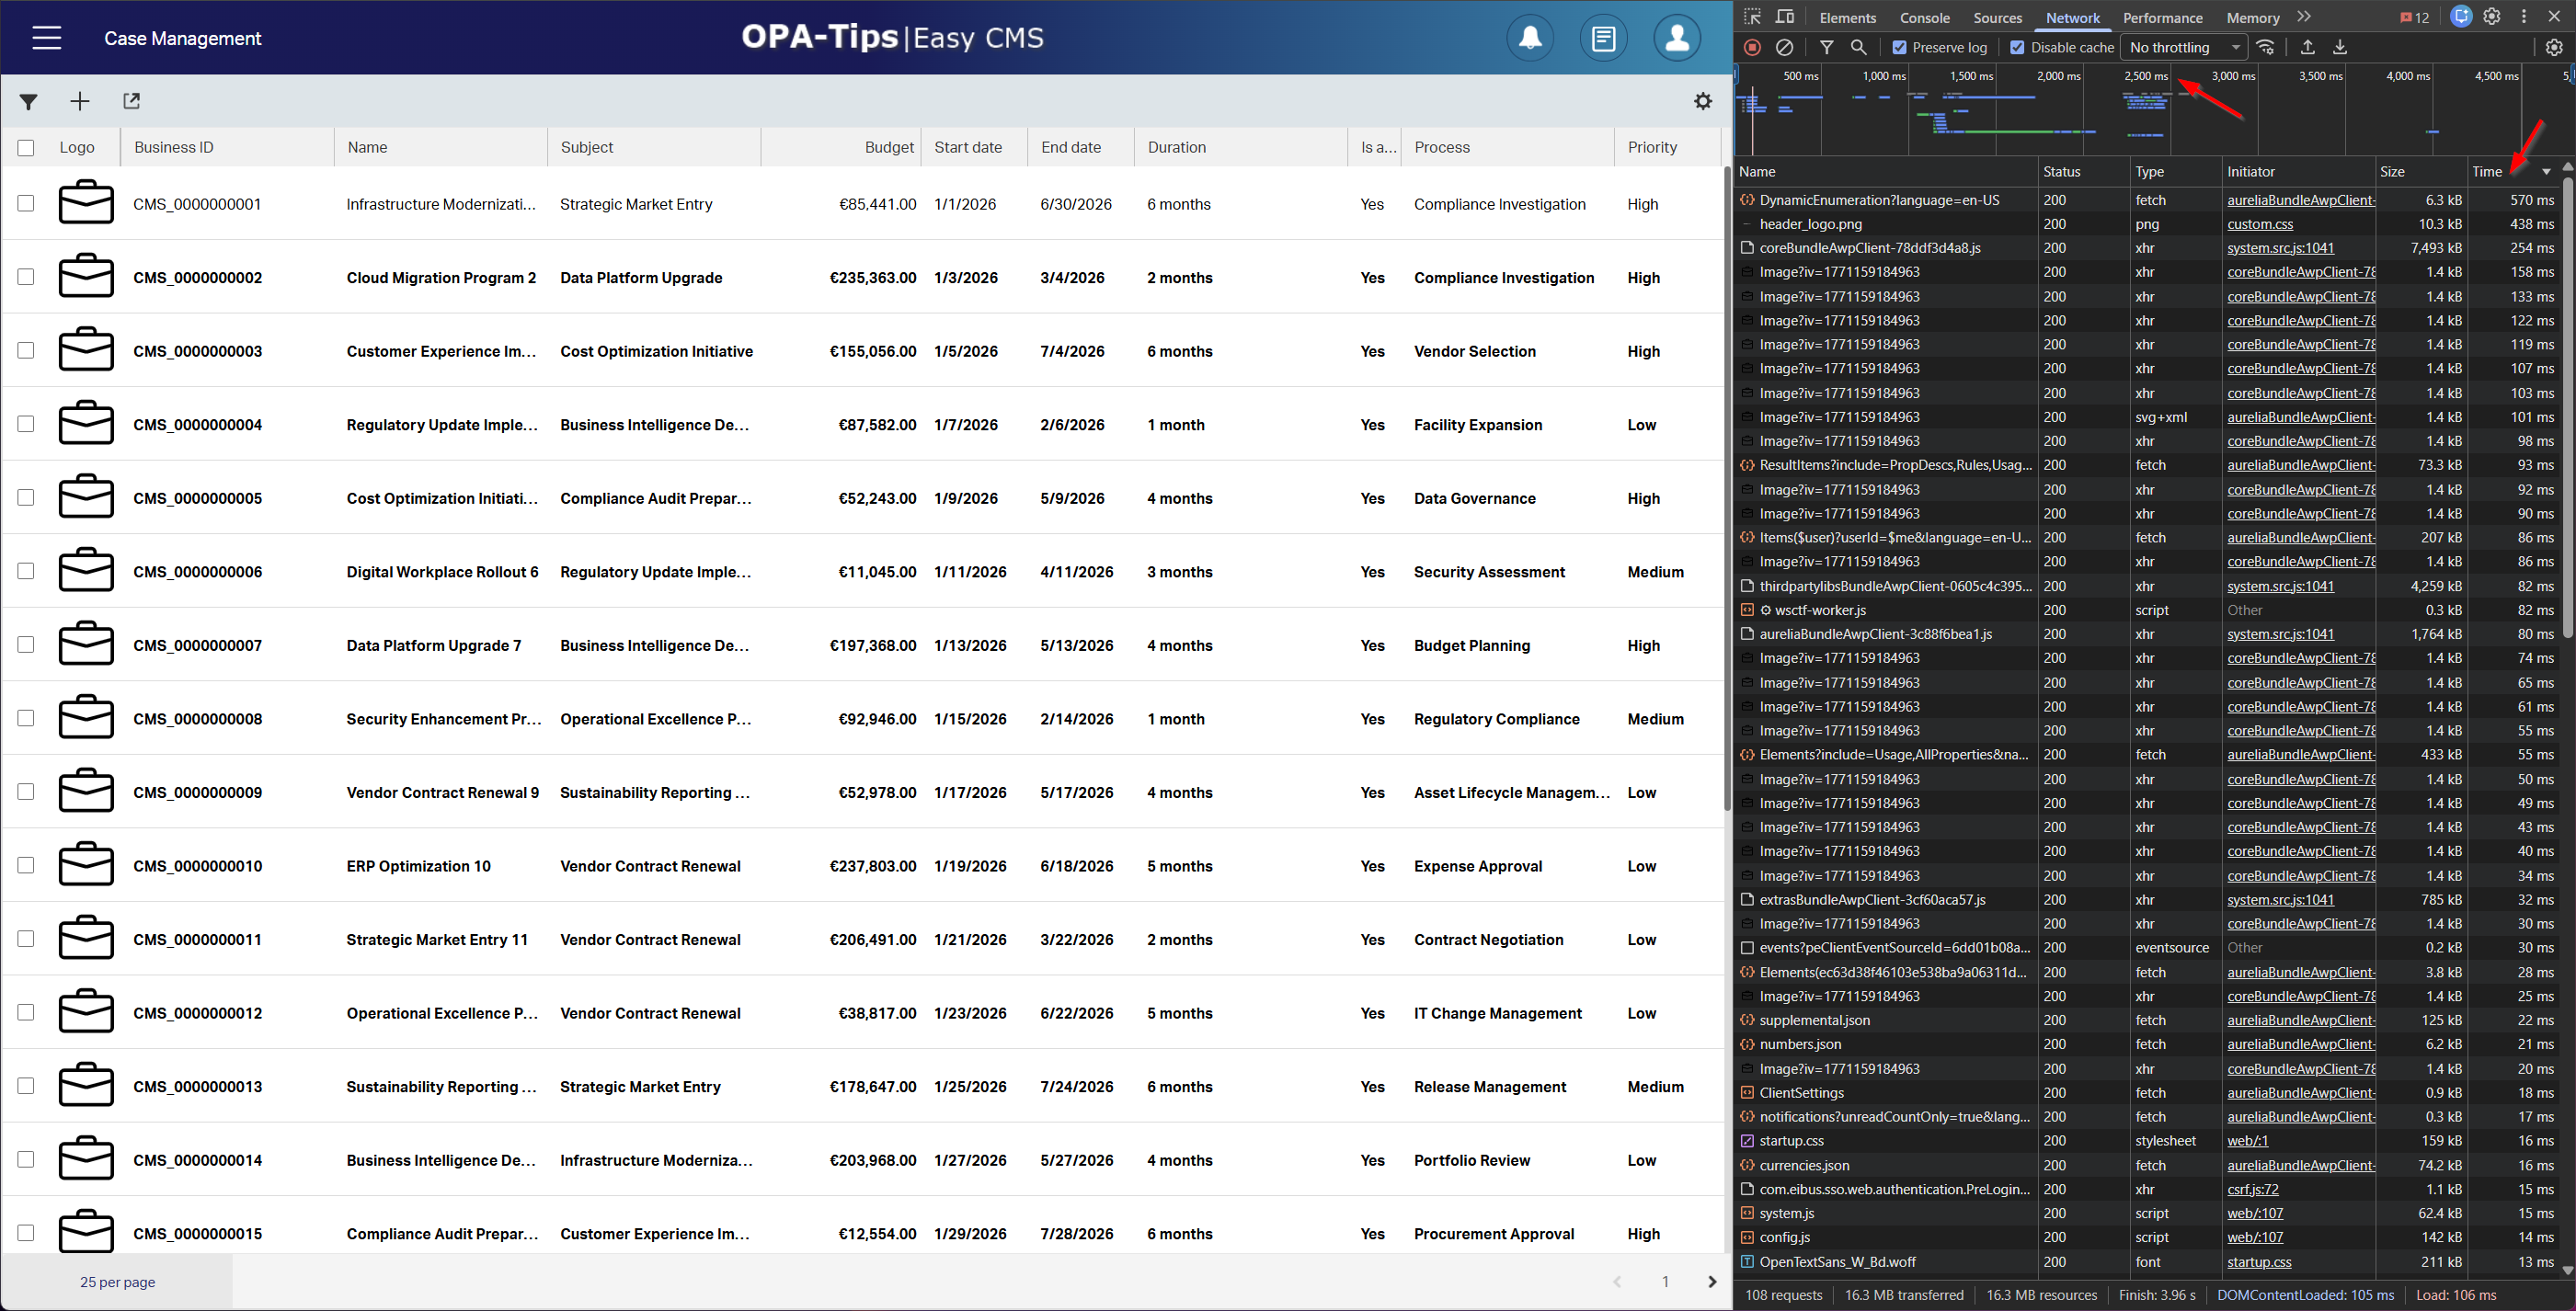
Data jumps in now, and after the page loading is done (for me a list of 25 case instances) we see the first results…What do we see?
- First order the ‘Time’ column descending (high to low) to see some fascinating results…If it’s acceptable, I leave with you…For my demo it’s quick enough; That’s also part of acceptance management.
- Watch the top bar on the timings; the full-page loading took 2.5 sec. Some calls are parallel, some sequential…AND you see gaps!
First conclusions:
- Dynamic Enums have an impact!…especially when you use the value in a list.
- The header logo has an impact!…Mine is rather small, but takes 0.5 sec. to load (it’s a PNG; with recommended size 445x31 pixels); Fascinating!
- File
coreBundleAwpClient...is 7Mb in size…Yes, that’s large for a condensed/minified JavaScript file! - Every case image is loaded again, and again! #WHY?
FYI: I’m on a local VM with Intel i7 CPU (using 2-cores for the VM) with 32Gb memory (using 16Gb for the VM) on an NVMe SSD (M.2 2280)
Time to clear the network log and create a new instance of my case:
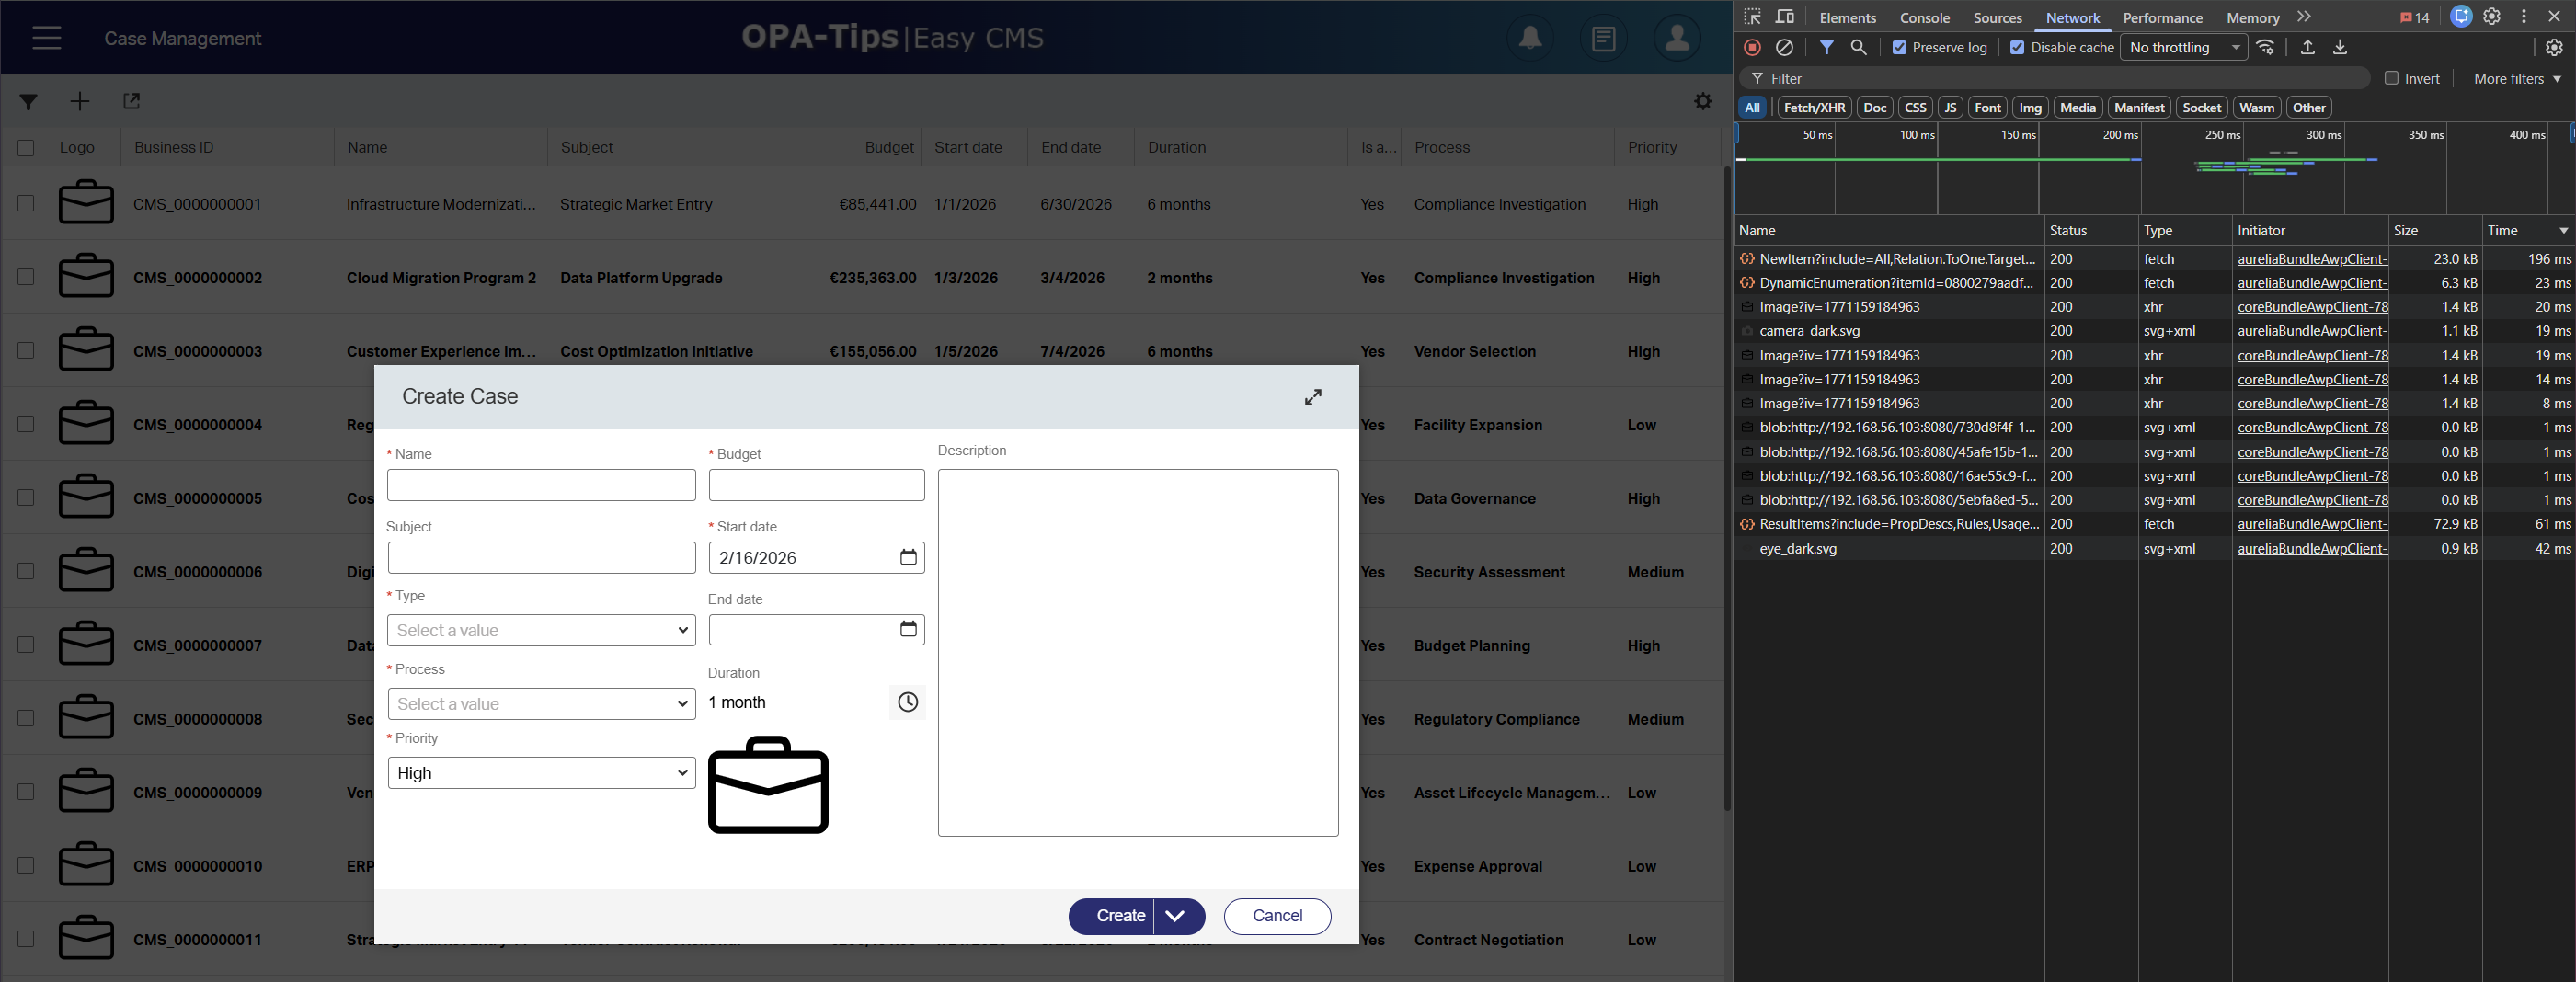
What do we see? Creating an item takes time:
- It loads the relation to ‘Type’
- Again, the dynamic Enum (my ‘Process’ list)
- Interesting is the multi-image loading…It happens four times!?
- 0.3 sec. is great, but it’s also a simple creation screen…Simplicity doesn’t need to be complex!
Time to clear again, and hit the ‘Create and open’ button (after providing input to the fields):
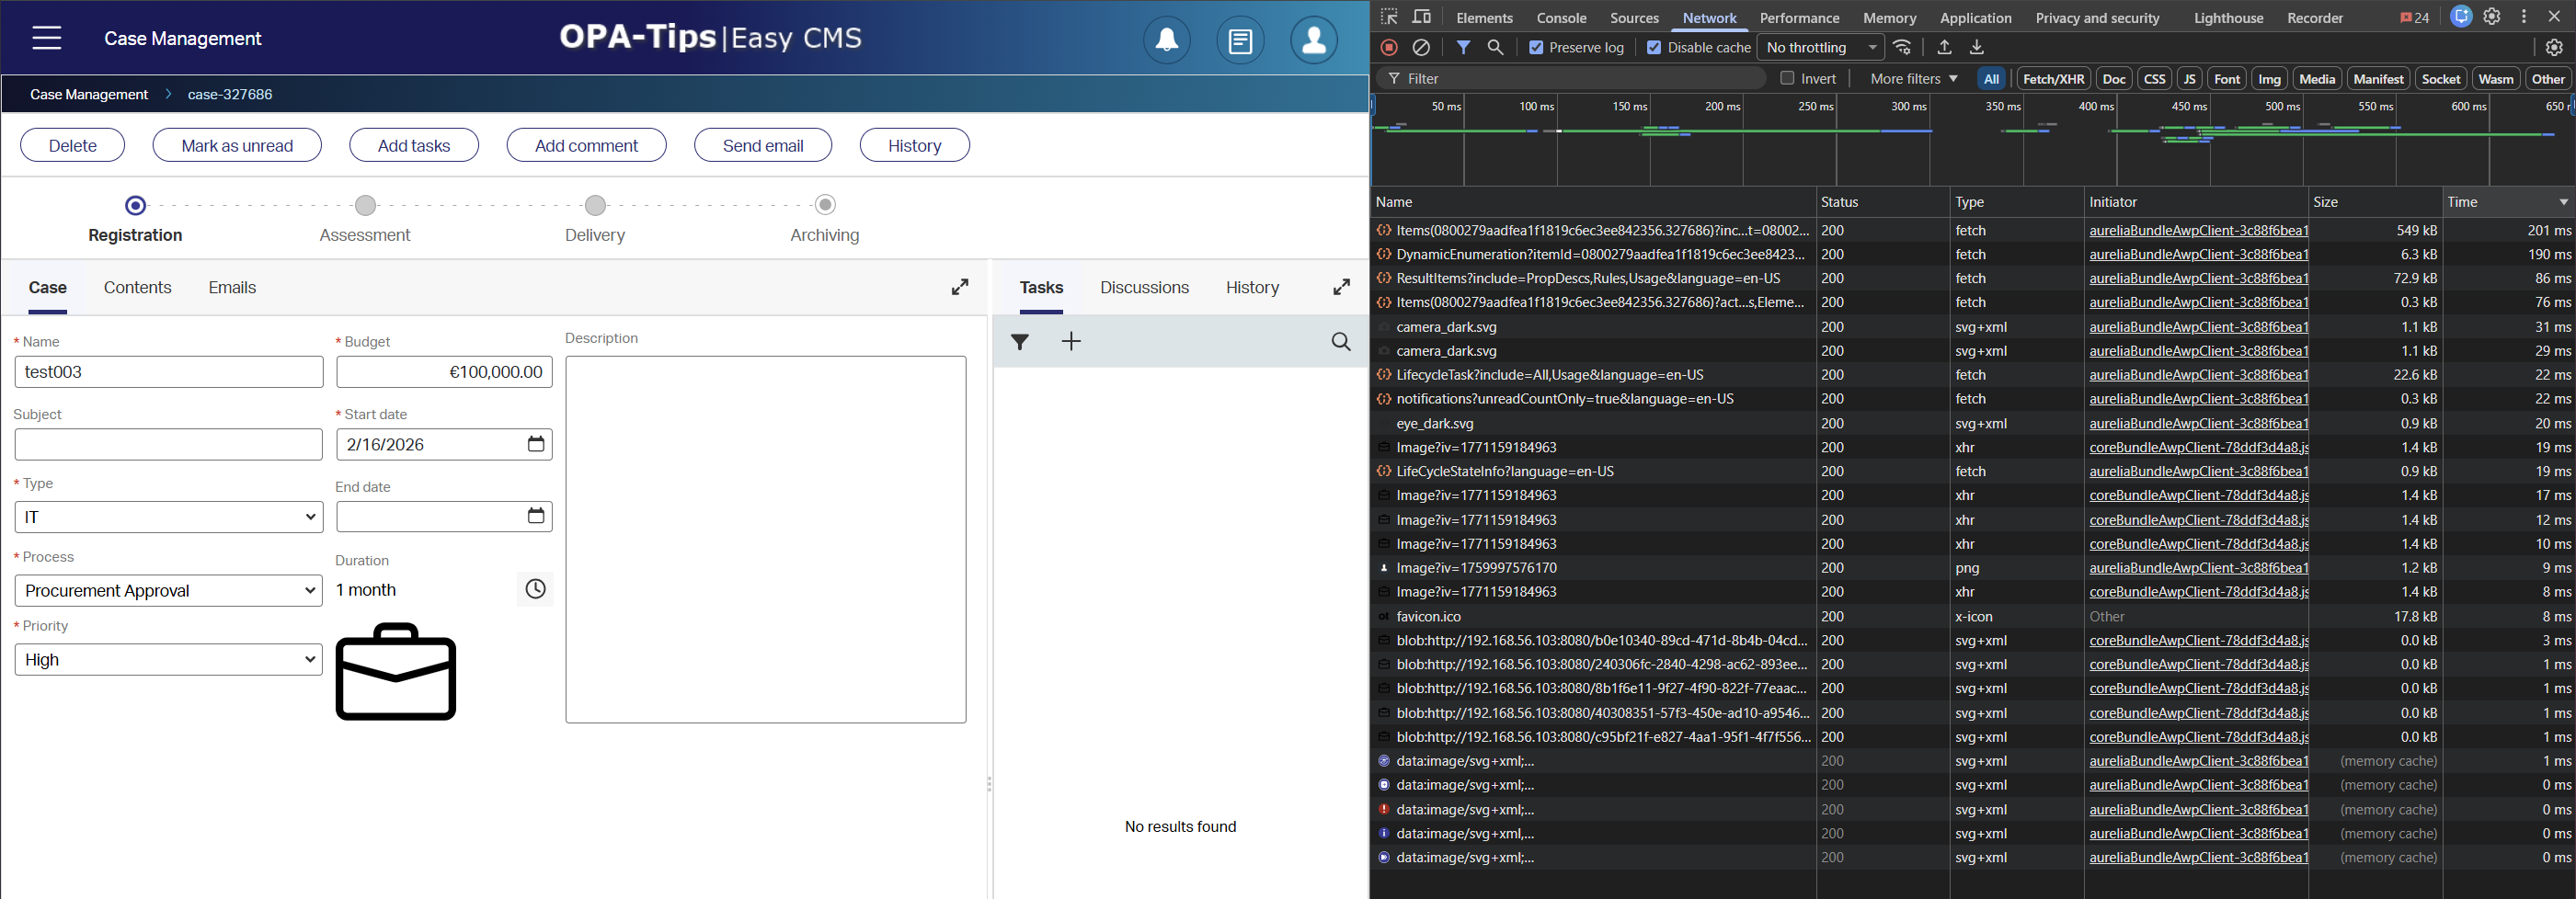
Wow…0.65 sec.!
Let’s be honest here; I did it 3 times and this was the fastest…1.2 sec. was the slowest; That’s still acceptable.
Conclusions:
- Dynamic Enum takes time again!…It’s indeed a BPM in the back-end; however, it’s short-lived.
- Lifecycle details (only states) get a part of the fetch-time. I don’t have any tasks (yet!) which makes it fast on itself already.
- The other tabs are not loaded as I don’t see any
ContentItems,Emails, andHistorycalls. (“Discussions” are part of the topItems(...)call!) - I’m also nearly to zero on business rules…Why do I know? Because I don’t see any
changeLogrequests passing by.
I also did a refresh of this entity case instance screen; This takes approximately 2 sec.
…
It’s all blazing fast now, but the more business logic you add, the slower it all gets. Watch out for this quick list of traps:
- Dropdown lists with lots of items
- Number of items in a list panel and the counter option at the bottom
- Multi-step BPM doing multiple logic steps behind a rule
- Rules to show/hide categories (on forms) and tabs (on layouts)
- Dropdown auto-suggest enablement
- Small cache times on dynamic Enums
- Advanced security model with lots of layers and conditions
- Showing too much information on one screen
- Inefficient rules that keep triggering a
changeLogevent - Password fields for encrypt/decrypt
- Sub BPM to Sub BPM
- Calling BPM from a lifecycle (better use a Rule)
- Number of relations on an entity
- Endless inheritance of entities
Also interesting to know is the availability (on the OpenText support site) of the PDF: “OpenText AppWorks Platform Performance and Tuning Guide”!
Now I hear you asking? How on earth can we build a solution without this list!? Well, you can’t! However, be incredibly careful with the configurations you make, as things can slide down performance wise very, very quickly! Keep measuring your changes, as it provides insights into a performance impact. Never show your end-users a blazing fast and non-functional UI…This only makes it harder to temper the expectations. Show a more enriched UI that is a little slower (but not tooooo slow); you can always remove functionality to make it faster…That’s the low-code placebo-effect, your end-users will accept.
…
Just a PRO-tip on an inefficient business rule building block:
Conditionalize the exact opposite of what you set!
…
Let’s dive into a next step; Well, it’s a next step we already described here. It’s all about exporting your network logging to a HAR file and analyzing it.
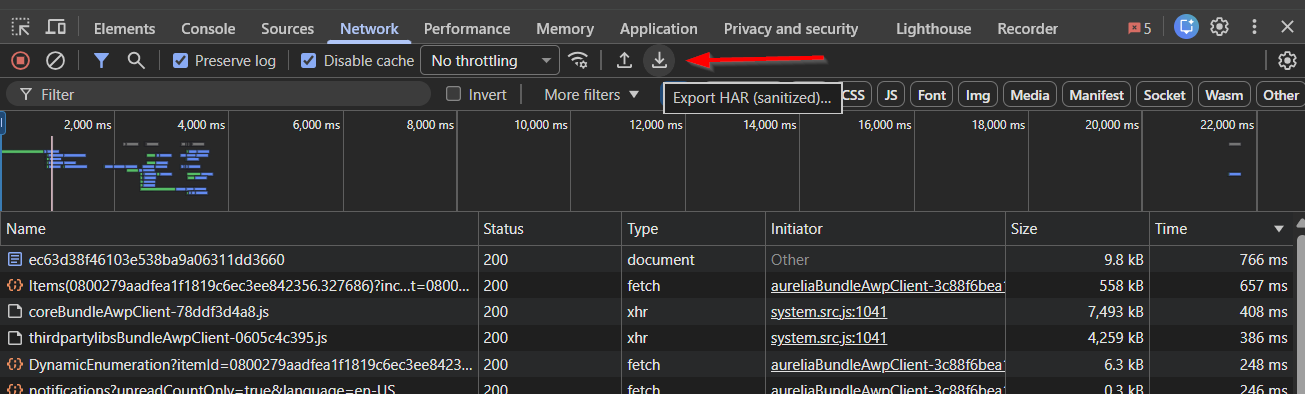
Another PRO-tip: upload it also to ChatGPT to analyze it; Before you upload clean it from sensitive data which is an option in the HAR Analyzer tool.
…
Finally, Google Chrome has another great tool to measure performance. It’s called “Lighthouse” as separate tab in the developer console of Chrome:
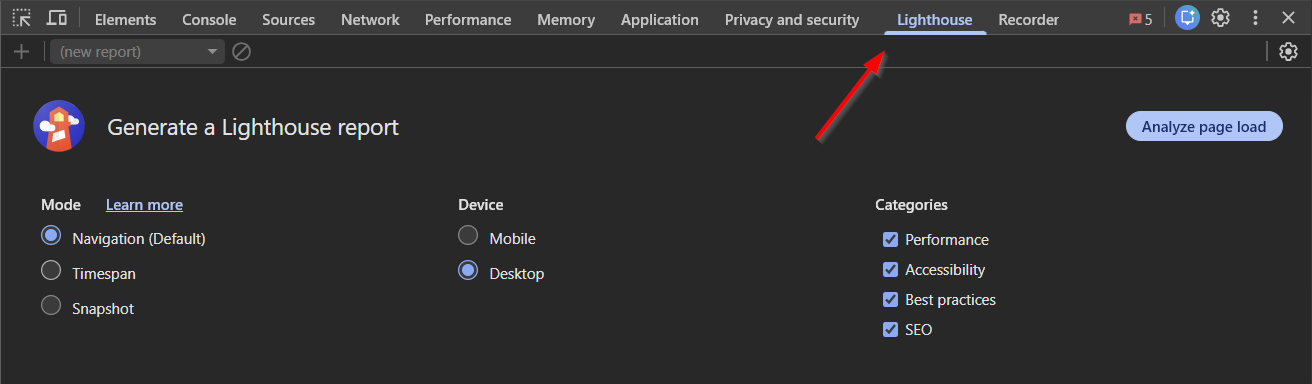
Well, hit that button and check the result for the current page (my case instance layout):
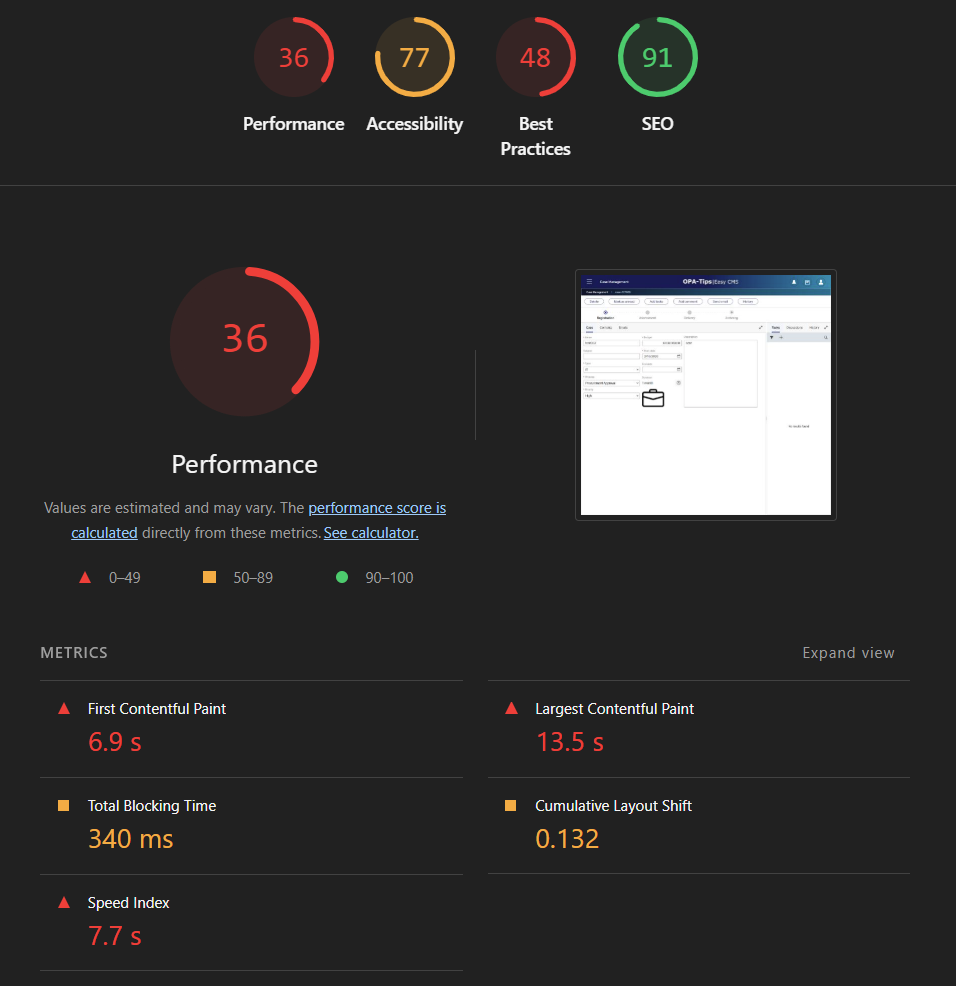
Ohw boy!! AND Yes, I did it three times; this was the fastest! Looks to me like there is still work to do on efficiency! There is also some nuance here as I’m on a simple TomEE HTTP/1.1 which is my lack of configuration; But I’ll put it on my backlog and share the difference in an update post against HTTP/2 over NGINX!
Lighthouse is an easy-to-use quick analysis tool for one page. It’s great, but real performance measurement happens over multiple calls over the full functionality of the solution. Things you can accomplish with Apache JMeter, Selenium WebDriver, and OpenText Professional Performance Engineering (aka “Loadrunner” from the good old days)
You saw screenshot passing for my new demo environment; You can find the OPA-Tips demo solution here which is under construction (when I have time left).
A great “DONE” where we gain insight into performance hits, list data collections, request timings, and a great overall lighthouse performance tool. It’s interesting to see how important the developer tools of Chrome are for you as performance analyst. This post explains the first topics to search for, and now it’s up to you to continue to dive into your specific performance hit. Let me know you findings in the comments below, and we’ll see each other next week in another topic about OpenText Process Automation Tips.
Don’t forget to subscribe to get updates on the activities happening on this site. Have you noticed the quiz where you find out if you are also “The Process Automation guy”?
