
Hi there “Process Automation” fans,
Welcome to a new installment of “Process Automation” tips.
We continue our journey on Grafana, but what have we seen so far?
- Post 1: Was all about installing Grafana, Prometheus, the JSON exporter, and gluing it all together into metrics values.
- Post 2: Was all about creating a first Grafana dashboard from the metrics, and showing it in a ‘Web content’ panel for a homepage layout in our beloved OPA platform.
- Post 3: Was all about creating a custom exporter in Python to query our Postgres DB for interesting numbers.
- Post 4: Our final post (this one) will show you the alerting mechanism in Prometheus when &^%$#&@^%$ hits the fan!
A question upfront: Why alerting in Prometheus and not in Grafana? Because with Prometheus we’re at the heart of our metrics (incl. the scraping times with no delays!)…Grafana is just sauce to make it look nice! Prometheus uses rule-based alerting decoupled from any UI which makes it also version controllable for the YAML-config files!
Let’s get right into it…
Our alerting (in this post) will send out an e-mail, so the first thing we need in place is an SMTP mail server! We use the simplest, and elegant mail server available “smtp4dev”. You can find an example in action here.
You can also alert to other “receivers” like MS-Teams, Slack, Discord, etc. (here’s an overview). Not for this post, but for you to further explore!
Next to this mail server (which I run locally on my Windows laptop), I also make sure my OPA VM is fully operational. This includes Grafana, Prometheus, the JSON exporter, and our custom DB exporter (written in Python).
Once all is running, we need to first install the Prometheus Alertmanager with these commands:
1 | wget https://github.com/prometheus/alertmanager/releases/download/v0.28.1/alertmanager-0.28.1.linux-amd64.tar.gz |
This is the starting input for the config file opa_config.yml
1 | global: |
Notes:
- Our “smtp4dev” mail-server accepts everything (all domains) for the from/to fields!
- I need to overrule the
require_tlswith afalsevalue to send a mail later down the drain in this post…
Now you can start “Alertmanager” (incl. the config file) with sudo /opt/prometheus/alertmanager/alertmanager --config.file=/opt/prometheus/alertmanager/opa_config.yml and watch the log in the console! Open the UI from your browser at: http://192.168.56.107:9093
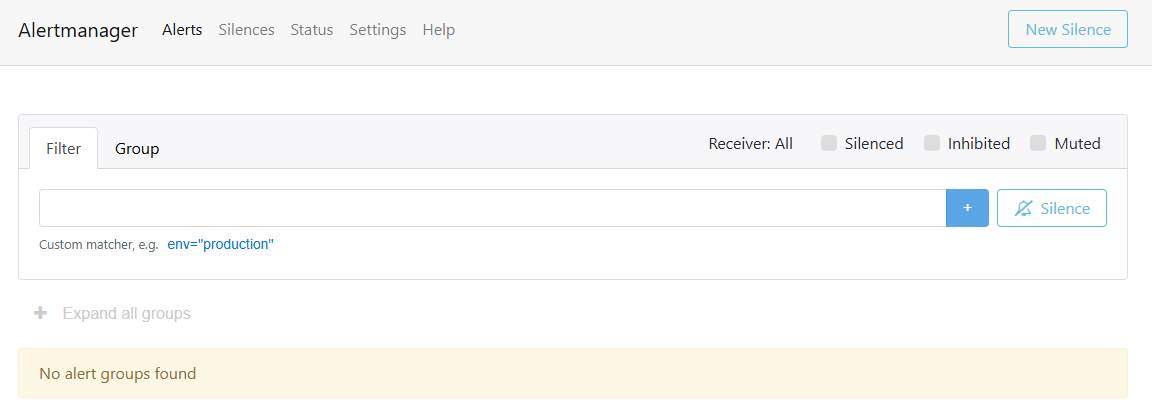
…
Our next step is to create rules for the manager (all nice loosely coupled!): sudo vi /opt/prometheus/alertmanager/opa_alert_rules.yml
1 | groups: |
Our JSON exporter exposes 7 UP services (for now #SUPPORT as it normally exposes more services on the OPA health end-point); when one is DOWN we’ll get a notification.
Next step is to add additional alerting configuration to the Prometheus config file (reading the rules from above and calling the alert system): sudo vi /opt/prometheus/opa_config.yml
1 | global: |
Stop <Ctrl>+<c> and restart Prometheus: sudo /opt/prometheus/prometheus --config.file=/opt/prometheus/opa_config.yml
In the Prometheus UI, you will see something like this:
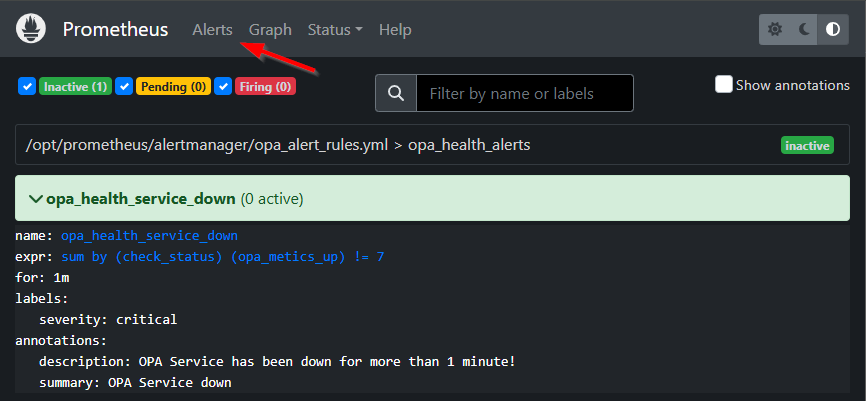
…
It’s time to shut down one of the service containers in OPA (in /system)! After a while you will see a movement going on:
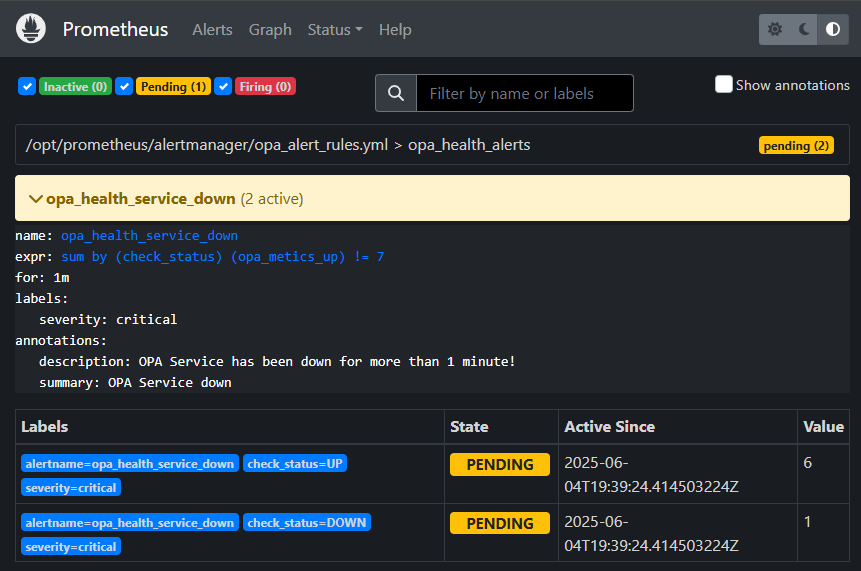
And after 1 minute (as configured!) it moves again:
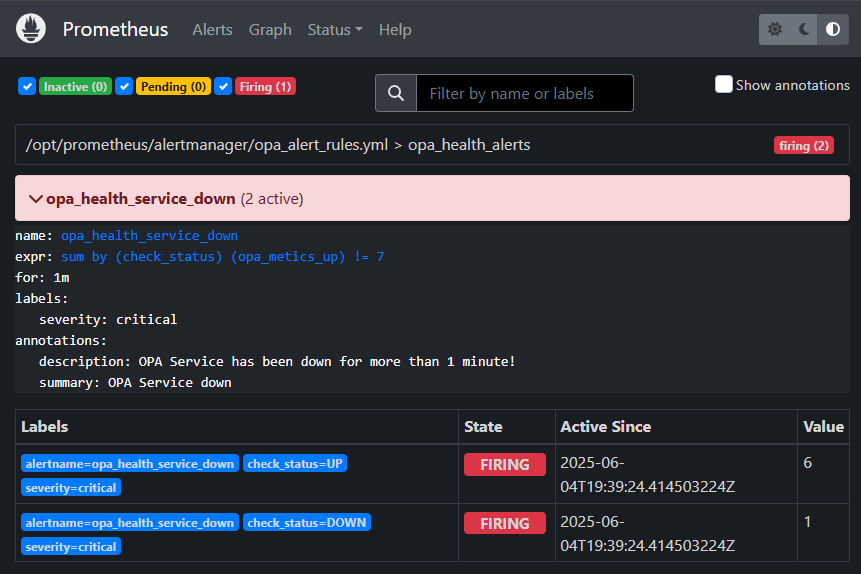
Now also the Alertmanager is involved with a new “Fired” alert:
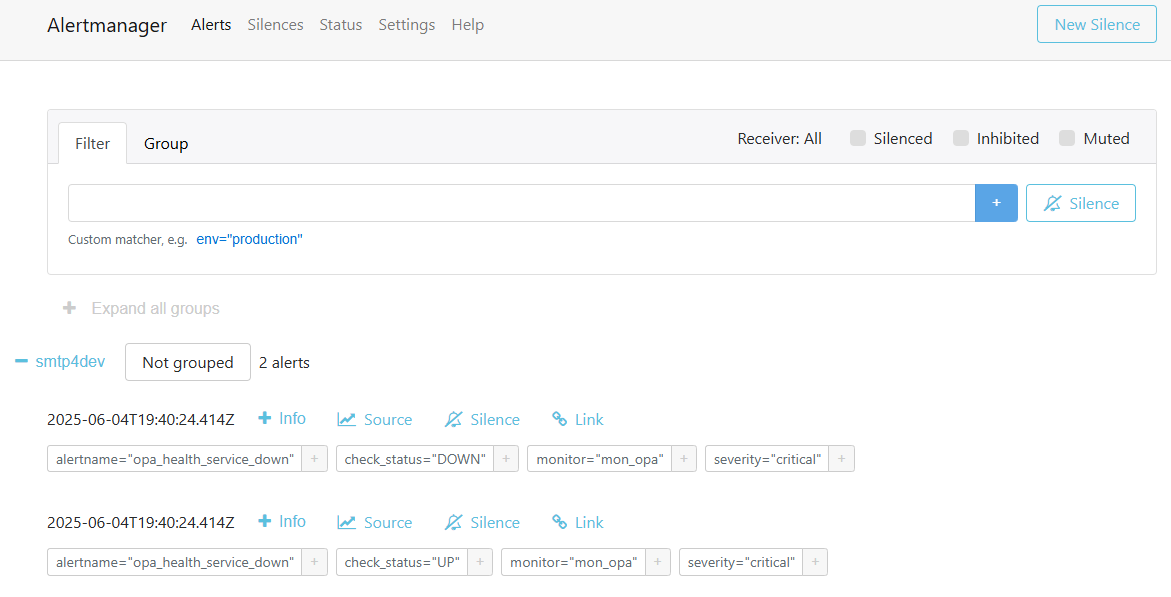
Fascinating to follow the flow! 👍
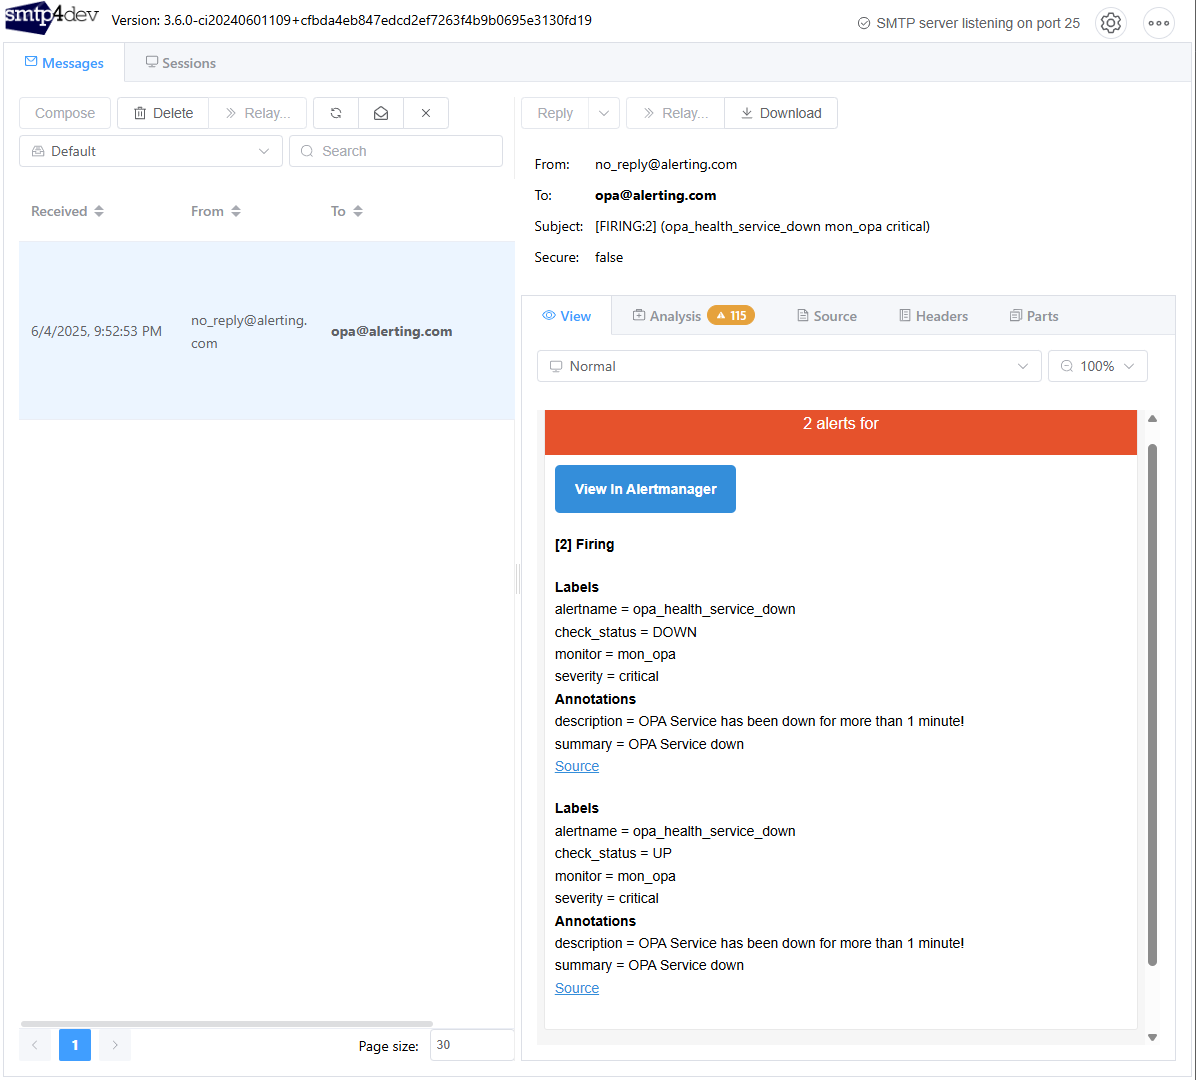
What about that mail? It’s nicely delivered:
…
A final question: What happens when we start the service container again? Well the alert in Prometheus gets back to in ‘inactive’ state…This completes the alert cycle! 👌
This concept works the same for our custom Python exporter querying the OPA database! That’s the power of metrics data and a loosely coupled implementation.
The MVP is running for consumption…I leave it up to you for further fine-tuning as I already see a glitch in the mail and the alert on two alerts for UP and DOWN!?…Not for now; I leave it with you!
…
These are some helpful resources from my side (with a little ChatGPT input on the config YML files). You can also follow those resources, but this blog puts it more in context of our beloved OPA platform.
- Prometheus Alerting Overview
- Prometheus Alertmanager YouTube example
- Step-by-step guide to setting up Prometheus Alertmanager
So, how hard can it be!? What I say…If I can do it, you can do it too! I give it a “DONE” with a final quick configurable alerting mechanism for our Prometheus metrics. The past 4 posts gave an interesting insight on Grafana, and its relevant services. It’s an interesting technique to play with and I will implement it at one of my customers if they allow me to do so. I’m brought to the other side of the line and belong now also to the group of enthusiastic people using these tools…I now also better understand the WHY!? Have a great weekend; We see each-other next week in another great topic for “Process Automation Tips”!
Don’t forget to subscribe to get updates on the activities happening on this site. Have you noticed the quiz where you find out if you are also “The Process Automation guy”?
