
Hi there “Process Automation” fans,
Welcome to a new installment of “Process Automation” tips.
Last week, we did an installation of Grafana with Prometheus and relevant exporters. All fascinating details where the end goal was a running Grafana server prepared for further dashboarding for our OPA platform. It’s also my first direct eXperience with this software, but this makes us already 80% more knowledgeable than the rest. That last 20% I leave during a customer implementation where new bumps in the road are always a new challenge.
It’s time to continue our journey on the basics of Grafana…
Let’s get right into it…
Boot up the machine with the OPA instance and make sure all tools run fine. So, that’s our TomEE for OPA; that’s systemctl status grafana-server for Grafana and additional calls to run the rest:
1 | sudo /opt/prometheus/prometheus --config.file=/opt/prometheus/opa_config.yml |
We could automate these last two as well, but for now it’s fine; At least for me for the flexibility in those YML-config-files!
This is the set of URLs we’re interested in for now:
- OPA health URL returning JSON:
http://192.168.56.107:8080/home/system/app/mp/health/ready - Grafana URL as clean instance:
http://192.168.56.107:3000 - Prometheus graphs:
http://192.168.56.107:9090/graph - Prometheus metrics:
http://192.168.56.107:9090/metrics - JSON exporter:
http://192.168.56.107:7979 - JSON probe-URL (for testing):
http://192.168.56.107:7979/probe?module=default&target=http://192.168.56.107:8080/home/system/app/mp/health/ready
The “PromQL” we will use for Grafana is this one: sum by(check_status) (opa_metics_up). So, that’s a sum of the ‘UP’ and ‘DOWN’ states. Shutdown some service containers in the OPA ‘/system’ organization and check the outcome:
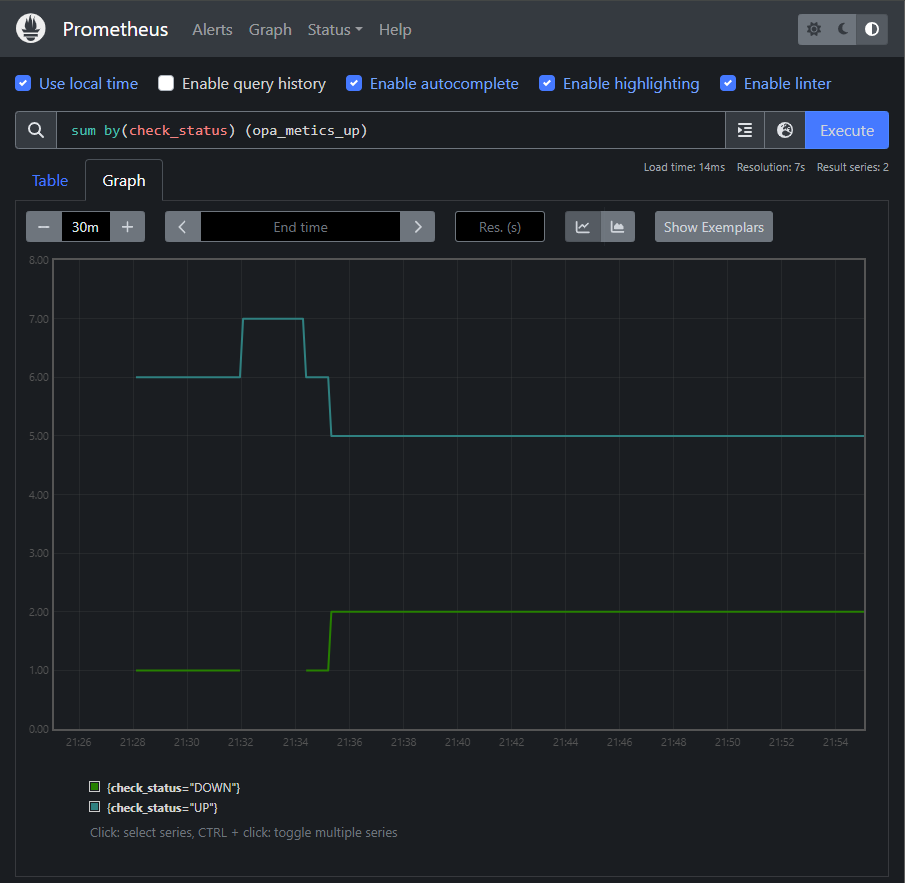
The health check URL currently returns (in JSON) max. 7 states; Time for #SUPPORT or #FEATURE_REQUEST as I know it’s normally more!
It’s time to move the Prometheus graph above into Grafana…
Configuration Grafana
Tune in to Grafana at http://192.168.56.107:3000 where we first add our Prometheus instance as new data source connection:
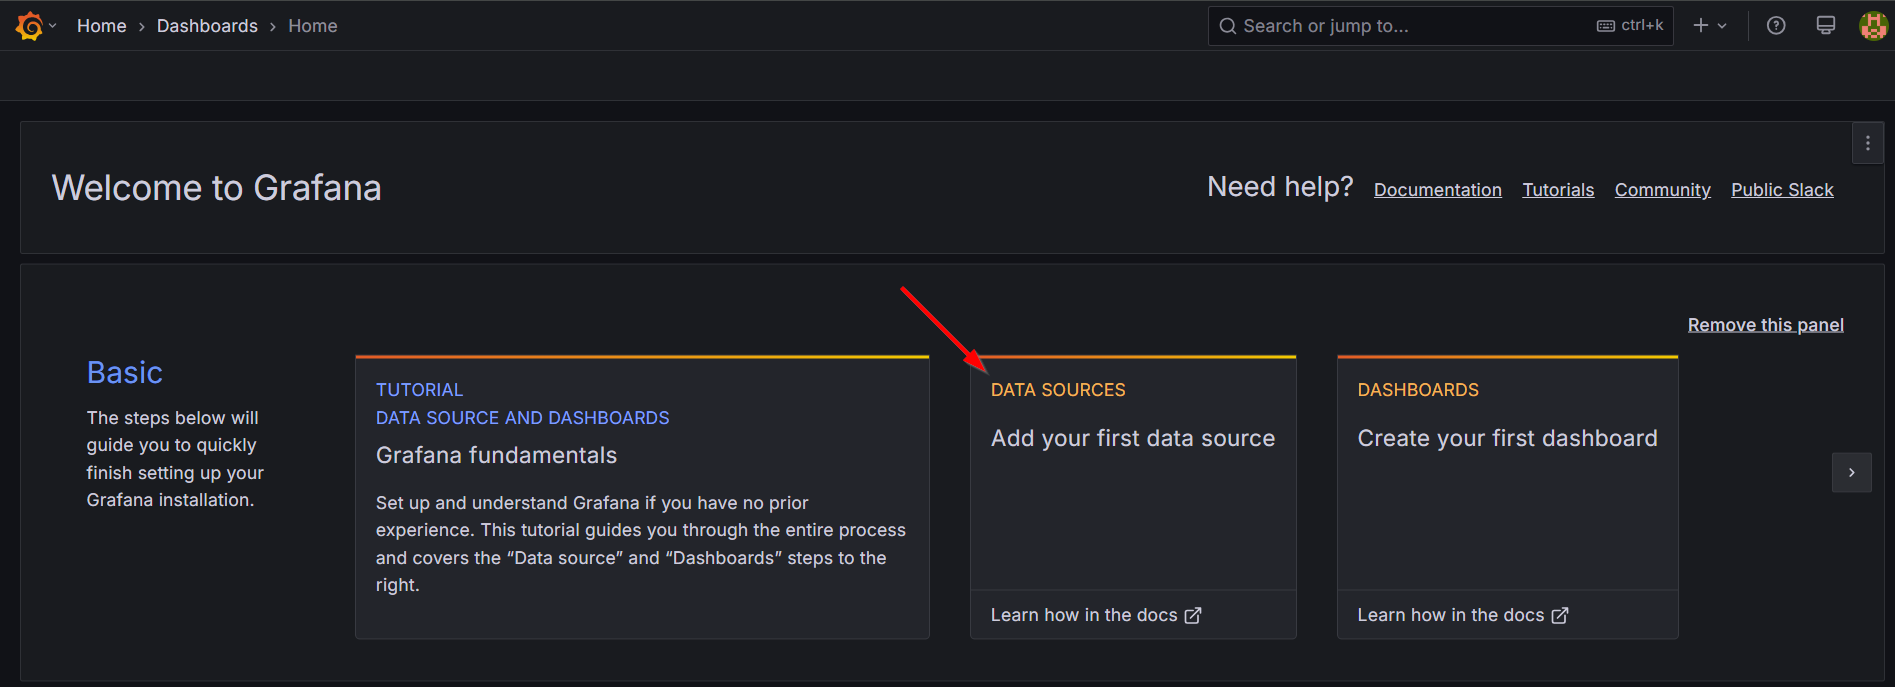
You can also use this quick URL:
http://192.168.56.107:3000/connections/add-new-connection?search=Prometheus
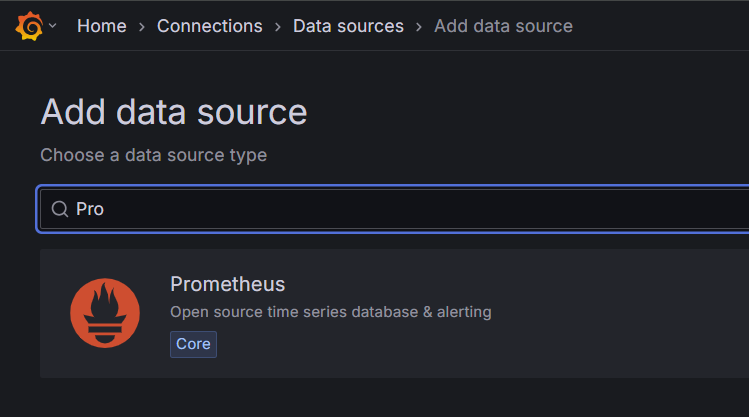
Select “Prometheus” as data type:
Set the correct URL (for me, it’s all on the same VM):
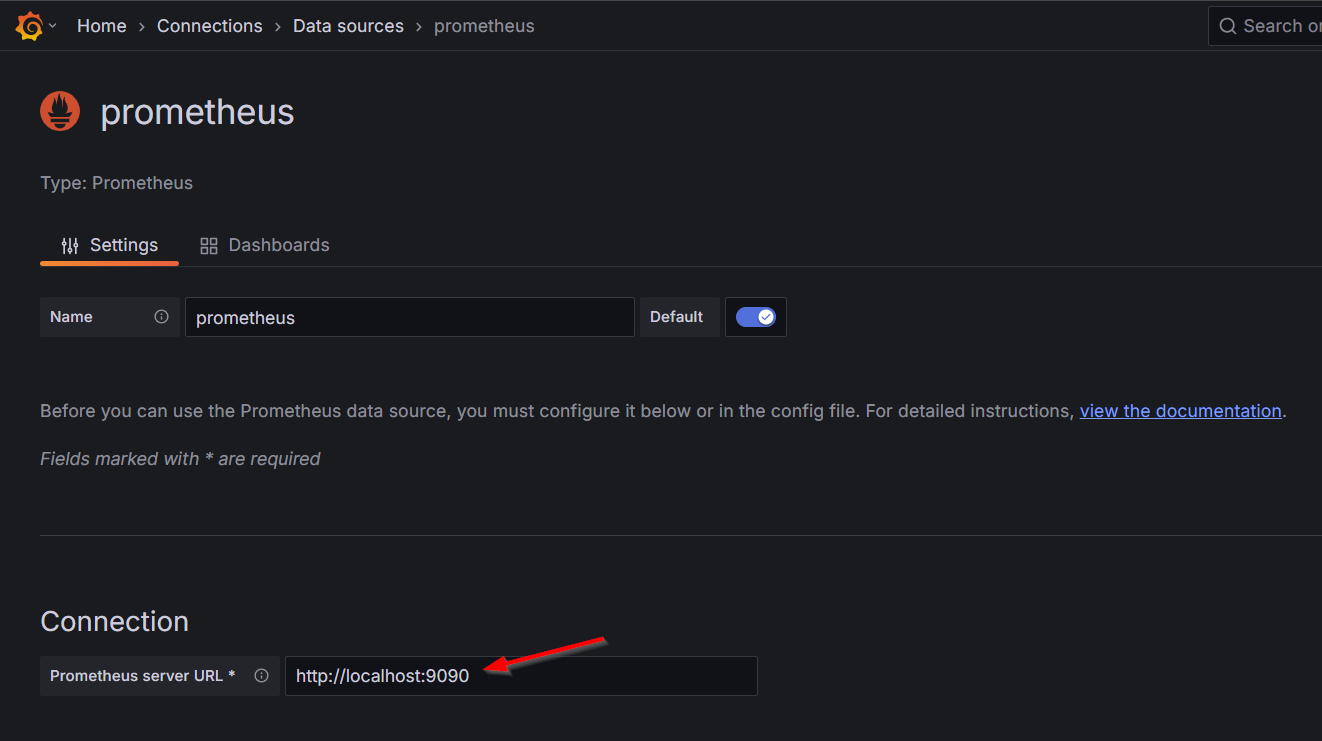
Leave all the rest for your own experiences, scroll down, and check for a valid connection using the “Save & Test” button.
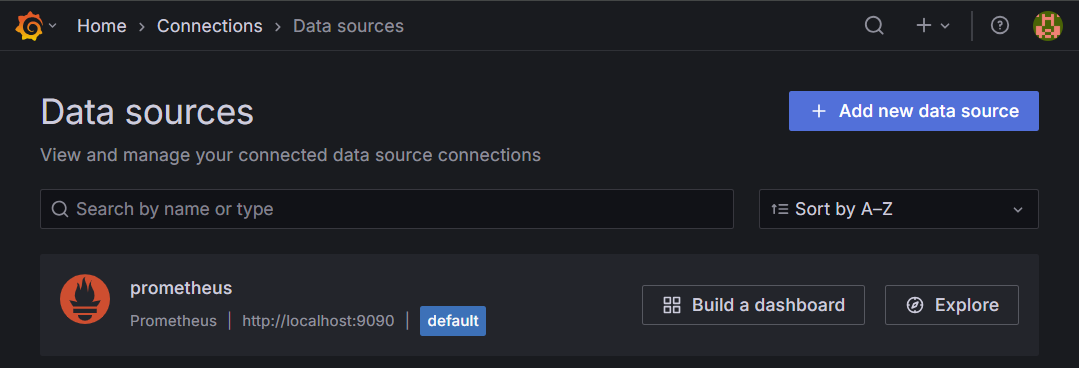
You can now find your data source at http://192.168.56.107:3000/connections/datasources for further exploration or dashboard building:
…
First the exploring phase where we can do a similar “PromQL”:
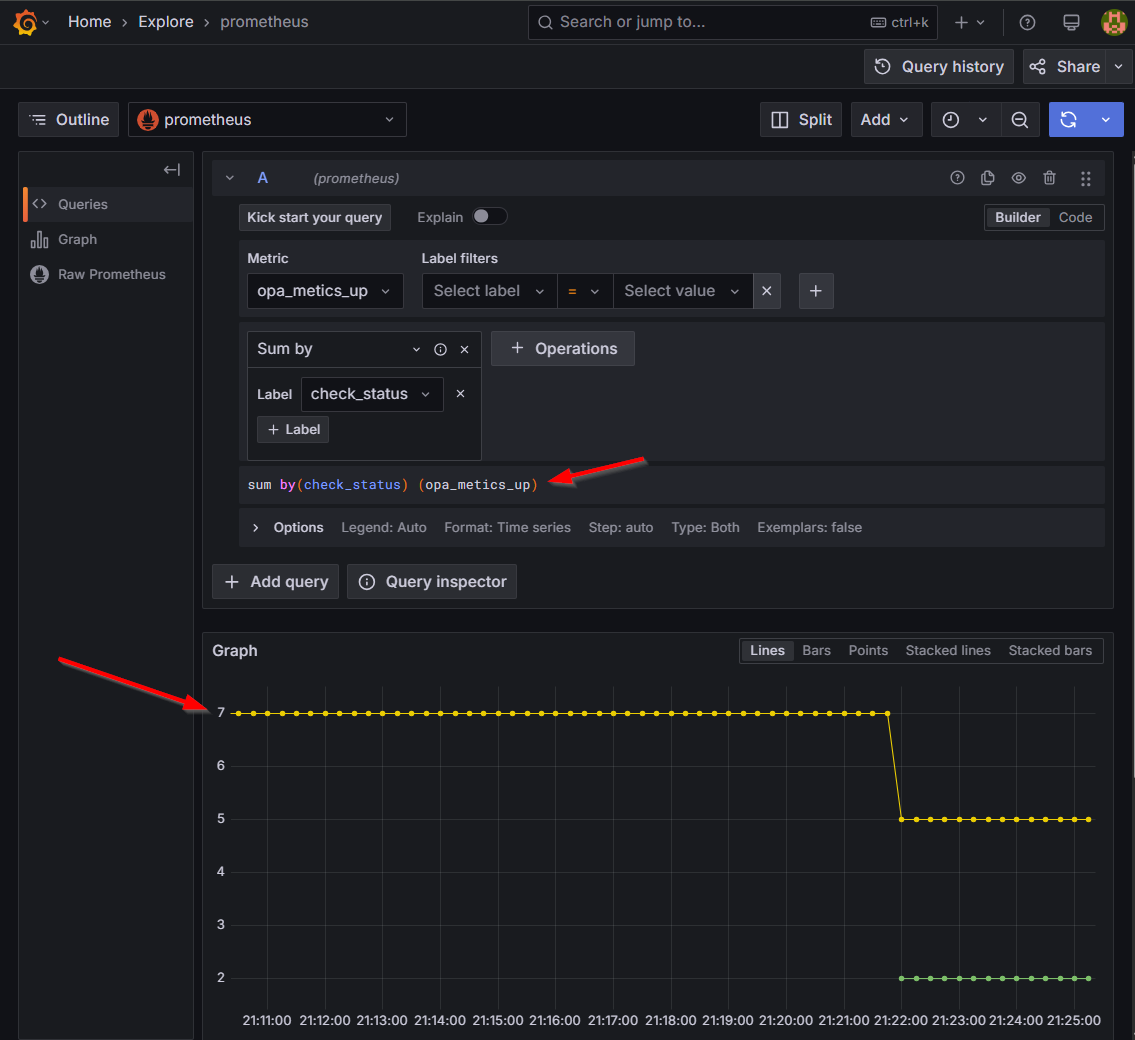
NICEEEE…It feels smoother too, but I guess that’s a placebo-effect. 🤩
…
Now, the dashboarding phase; I would say…Hit it!
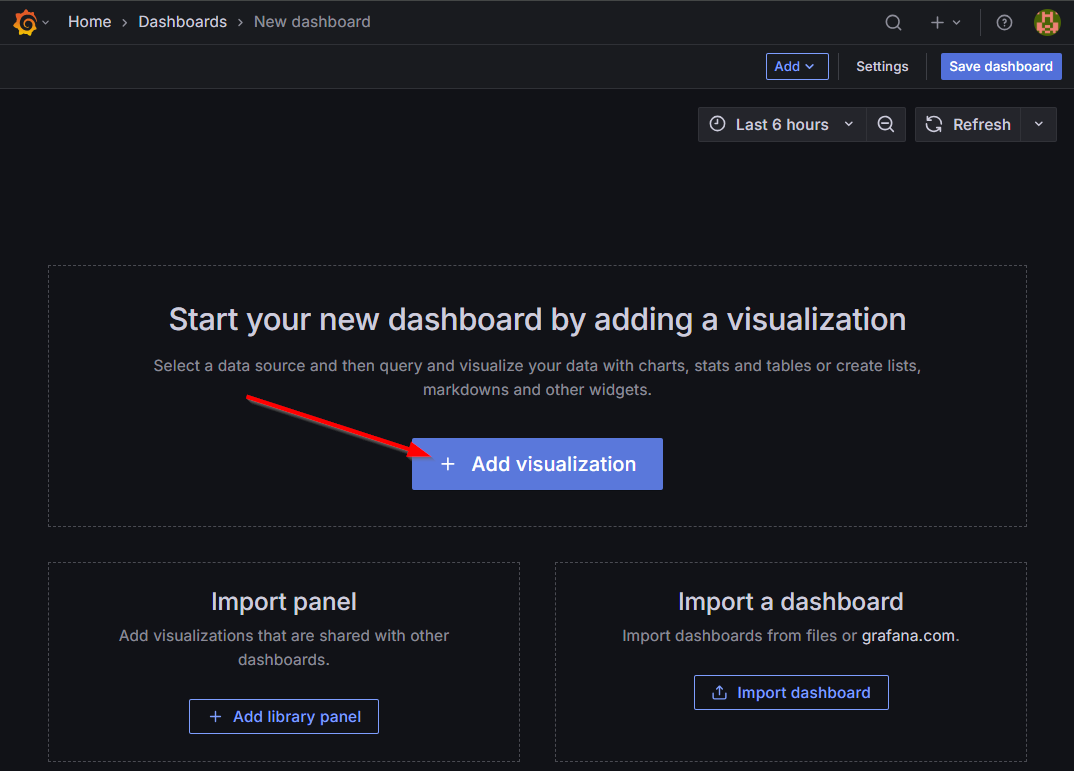
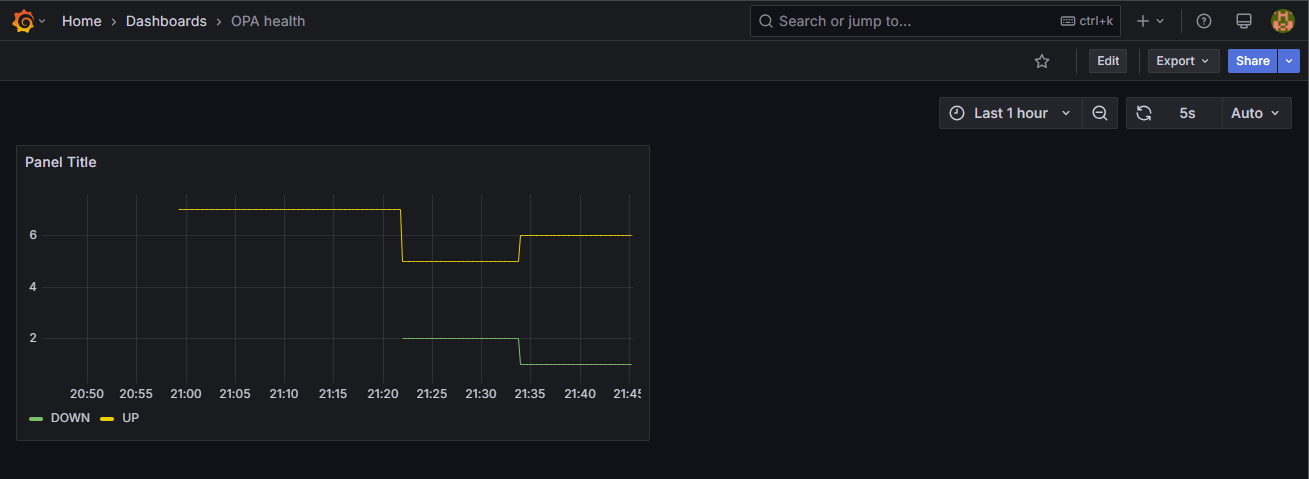
After the selection of the Prometheus data source type, you will see a screen for adding a panel. It looks complex, but when you simply add the same “PromQL” at the bottom and hit the refresh button you have your data available again:
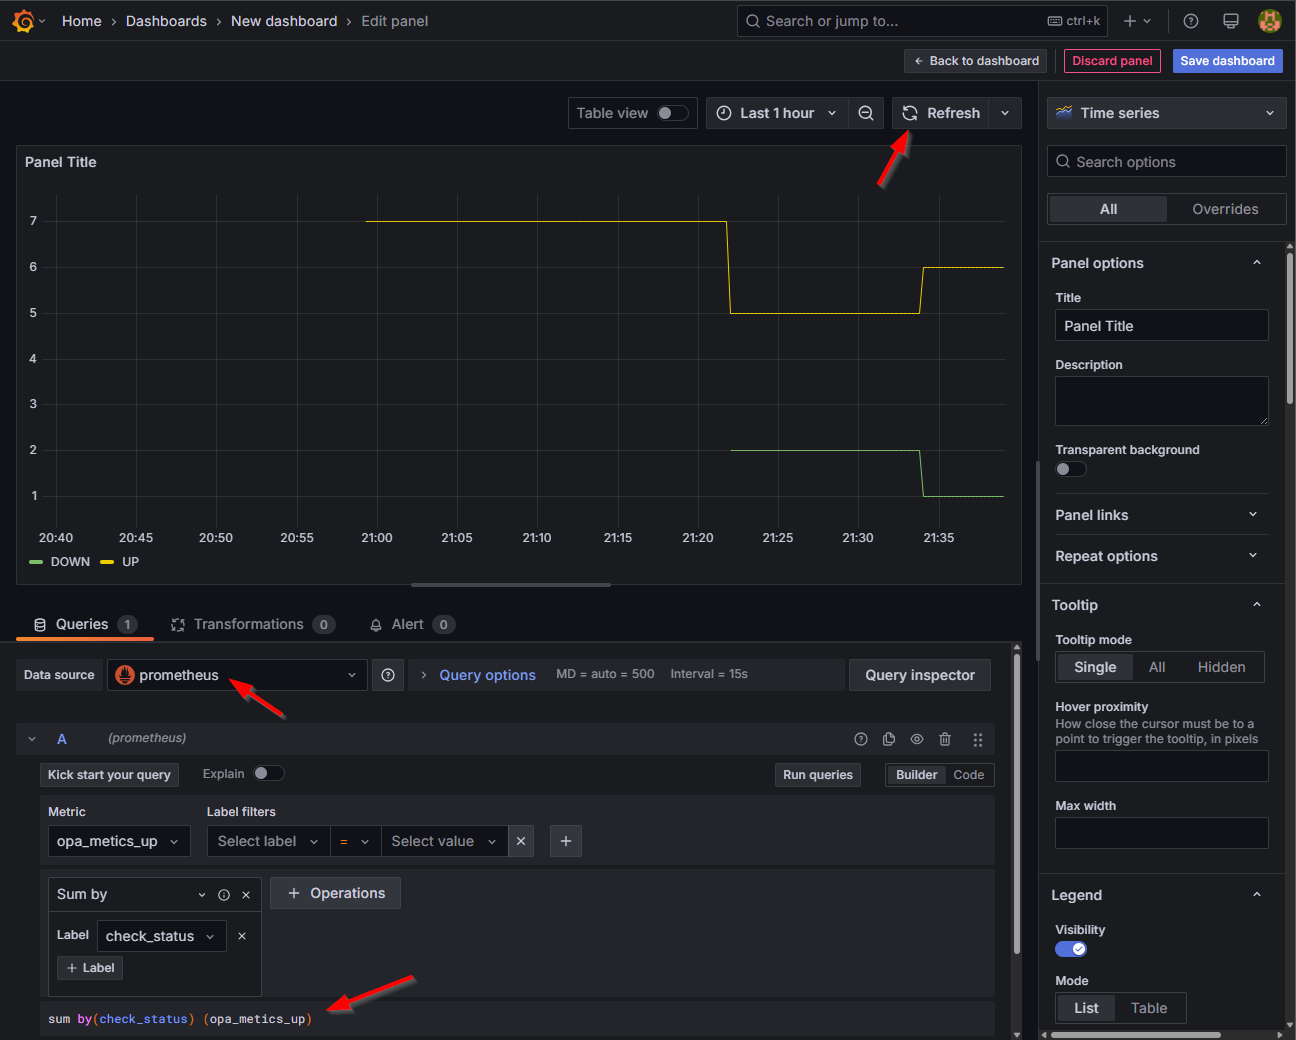
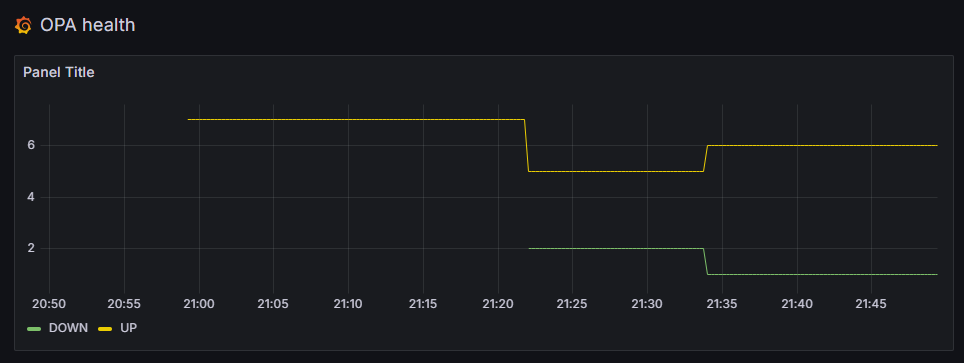
You can now save this dashboard with name OPA health and have it ready for consumption:
Cool!…it’s now only a one-panel dashboard, but you can add multiple panels too (from other metrics…Not for now!)
Time to hit the ‘Share’-button…Use the “external” share option instead of the regular “internal” share which makes the dashboard nicely available with a URL like this: http://192.168.56.107:3000/public-dashboards/c26c861d54744f2798e9fd3f326f19c4
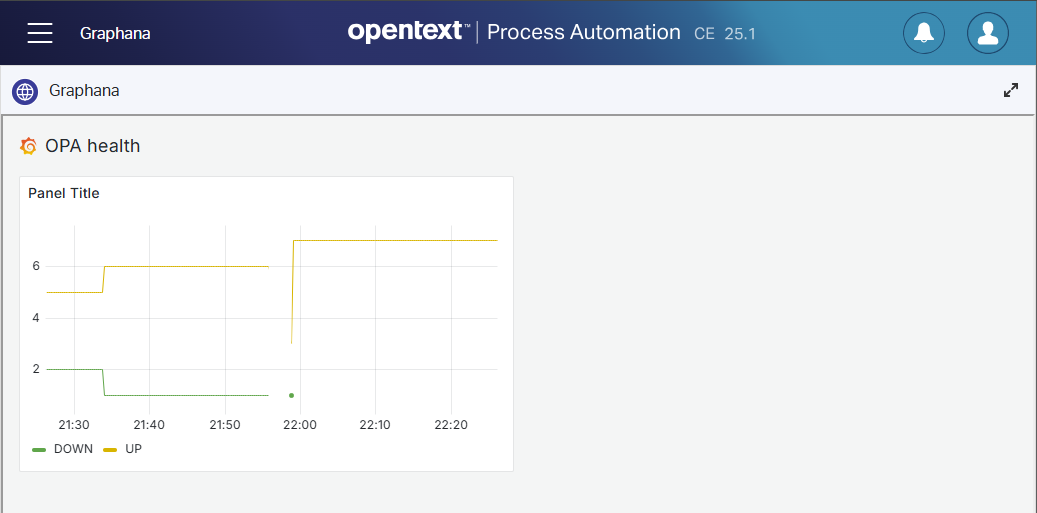
This URL makes it interesting as we can now (from a Process Automation) standpoint use this URL in a “Web Content” panel for an entity layout or for generic insight on a homepage layout:
Notes:
- To make this work validly also set
allow_embedding = trueinsudo vi /etc/grafana/grafana.iniand do a restartsystemctl restart grafana-server. The reason is to set aX-Frame-Optionsdenial in the response of Grafana to avoid it to load within an HTML iFrame element! Read about it here.- To make the Grafana theme “light” you need to change you Grafana profile settings. After this, (not sure!) you also need to re-share your dashboard link to see the light theme (this is not 100% validated as later I see it switched back!?)
That’s a party for this post! 🥳 I leave the rest of the fine-tuning of your dashboard to you, but we’ve covered the basics for now!
That’s a second “DONE” for our Grafana knowledge; The more I play with it, the more enthusiastic I get about it. You need to learn the basic tricks, but when you understand the concepts it’s a valuable tool to work with. With exporters, you channel data back to metrics, Prometheus understands these metrics as “time series database”, where Grafana is the consuming part gluing is all together…AND all nicely loosely coupled over different services; A wet dream for all architects! Have a great weekend and be prepared for next week when we introduce the OPA database (Postgres) to our Grafana-party.
Don’t forget to subscribe to get updates on the activities happening on this site. Have you noticed the quiz where you find out if you are also “The Process Automation guy”?
