
Hi there AppWorks fans,
Welcome to a new installment of AppWorks tips.
At a customer we hit the wall with a performance issue on our beloved AppWorks platform. The exact reason is always hard the tackle and mostly is a combination of different layers; Like the platform itself, the OS, the TomEE webapp server, the database, the network, the solution, the traffic, the concurrent users, anything is open for discussion. This also happens with lots of pressure from top management (as expected) and under pressure a lot of things get fluid AND with this, all the experts join the meeting AND that’s exactly where the finest tools and tricks expose their power to solve the problem. Tools out of the box, but also custom-made tools we didn’t know exist already! Interesting…
I will not dive into any details on the performance issue at the customer, but I do want to share some tricks that can help you as well. It’s also new stuff to me, it is pretty techie, but worth the share…
Let’s get right into it…
Before we dive into the tooling, we first want to introduce a performance hit on our platform and the first thing I can think of is a simple infinite-true-loop on a short-lived BPM that needs to send back a synchronized message into runtime on initialization (a ‘Rule’) for an entity creation! 😁
Don’t do this stuff at your customer; I’m in a sandbox VM to try out these kinds of features!
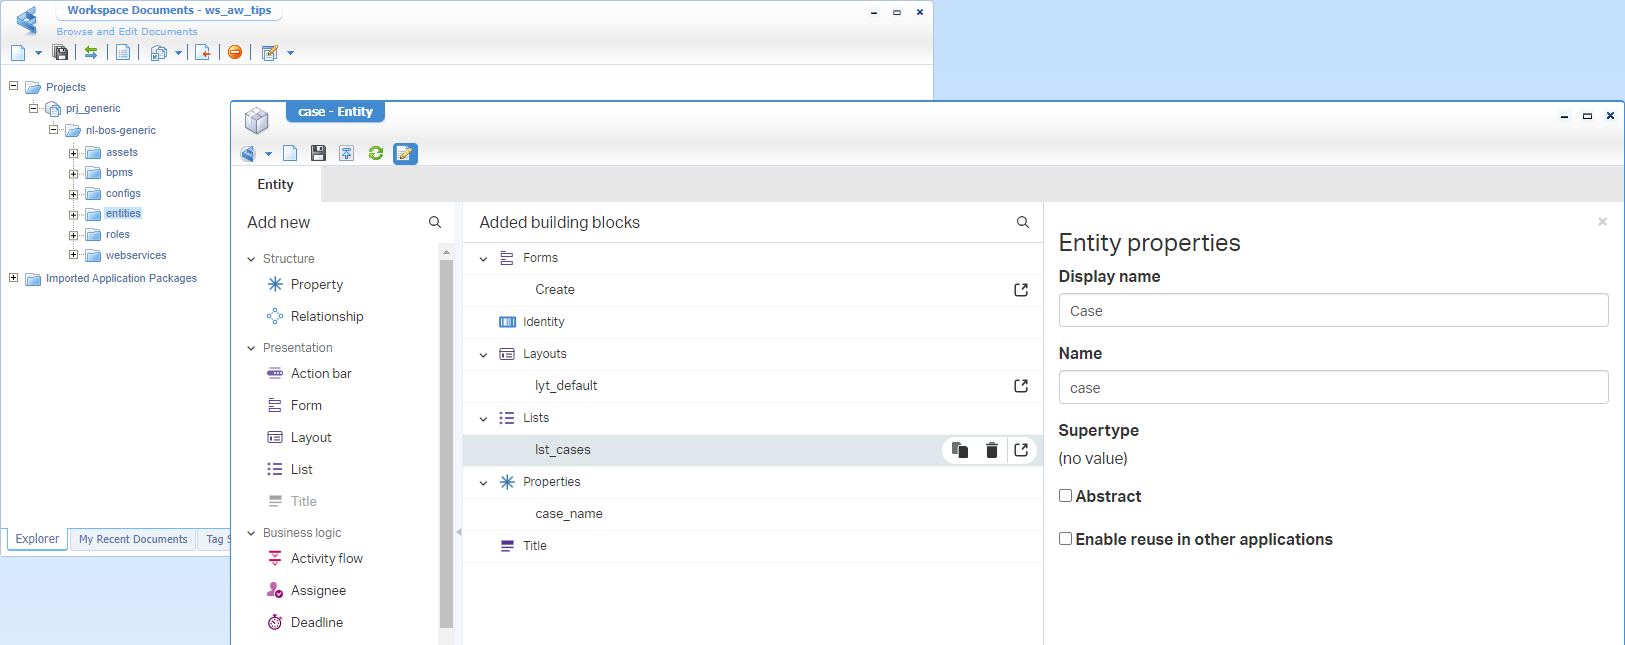
So, boost your VM, open the corresponding URL for designing our project in the relevant workspace, and start with a first case entity. Use a simple case_name property and make it nice and shiny (let me know in the comment if you need more guidance…). This is my starting point:
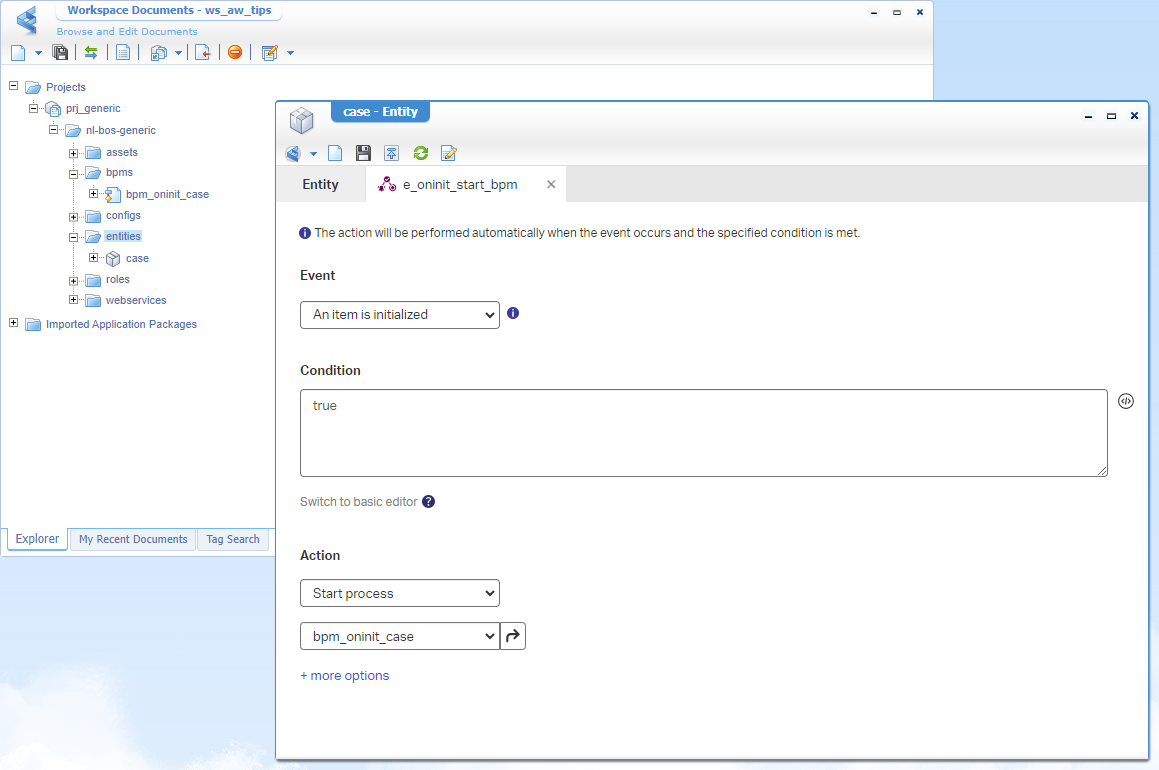
Next, we create a new ‘Rule’ building block of type ‘event’ with the fancy name e_oninit_start_bpm (or e_oi_start_bpm). You can do a first implementation like this:
An interesting naming convention can be like this (have a comment below…):
- onInit =
e_oi_- onCreate =
e_oc_- onPropChange =
e_opc_- onRelChange =
e_orc_- onDelete =
e_od_- onShare =
e_os_- onUnShare =
e_ous_
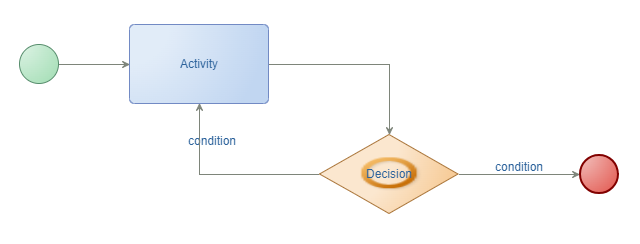
The BPM bpm_oninit_case (saved in the bpms folder of the project) for that rule will get a first basic implementation like this:
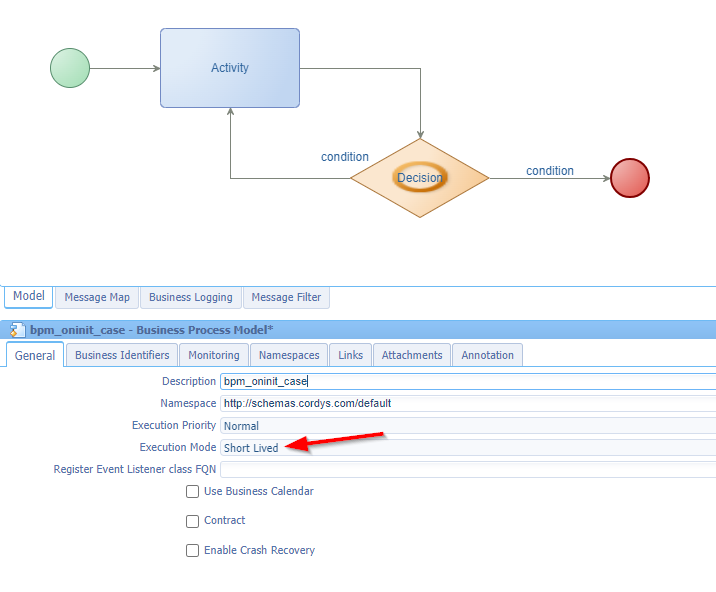
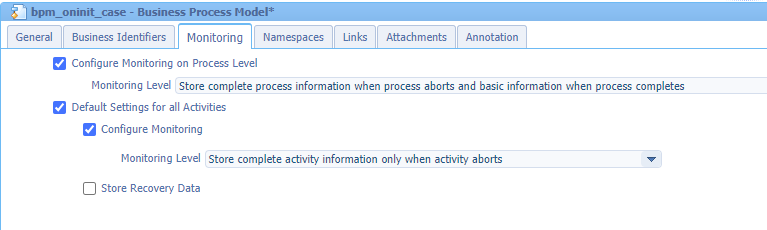
To extend the BPM, we start with the basic change on process level making it a short-lived process (this way we get direct feedback in runtime):
Have a look at the changed ‘Monitoring’ settings which we (at our project) always reset to this default setting (again, have a comment…):
Next, we implement the decision split with a solid “exclusive” type of choice to go left/right:
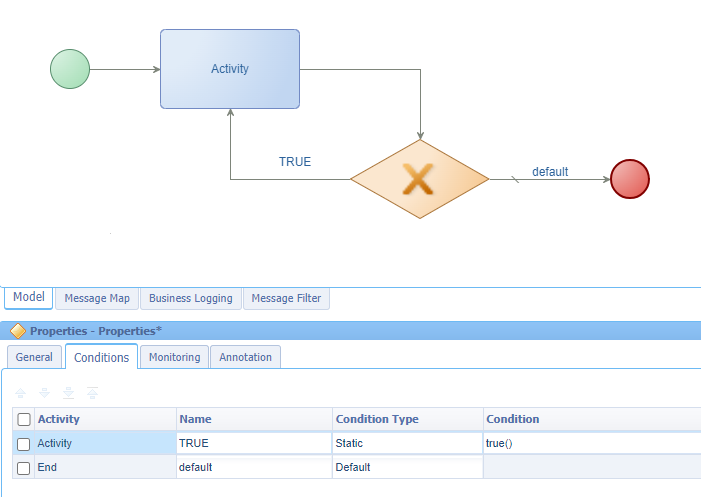
That’s it…The horror BPM is ready (incl. the rest of the project) for a publication into runtime!
HTTP Archive (HAR)
Before triggering the creation of a new ‘Case’ entity, we first make sure to put some developer tools <F12> in Chrome in place.
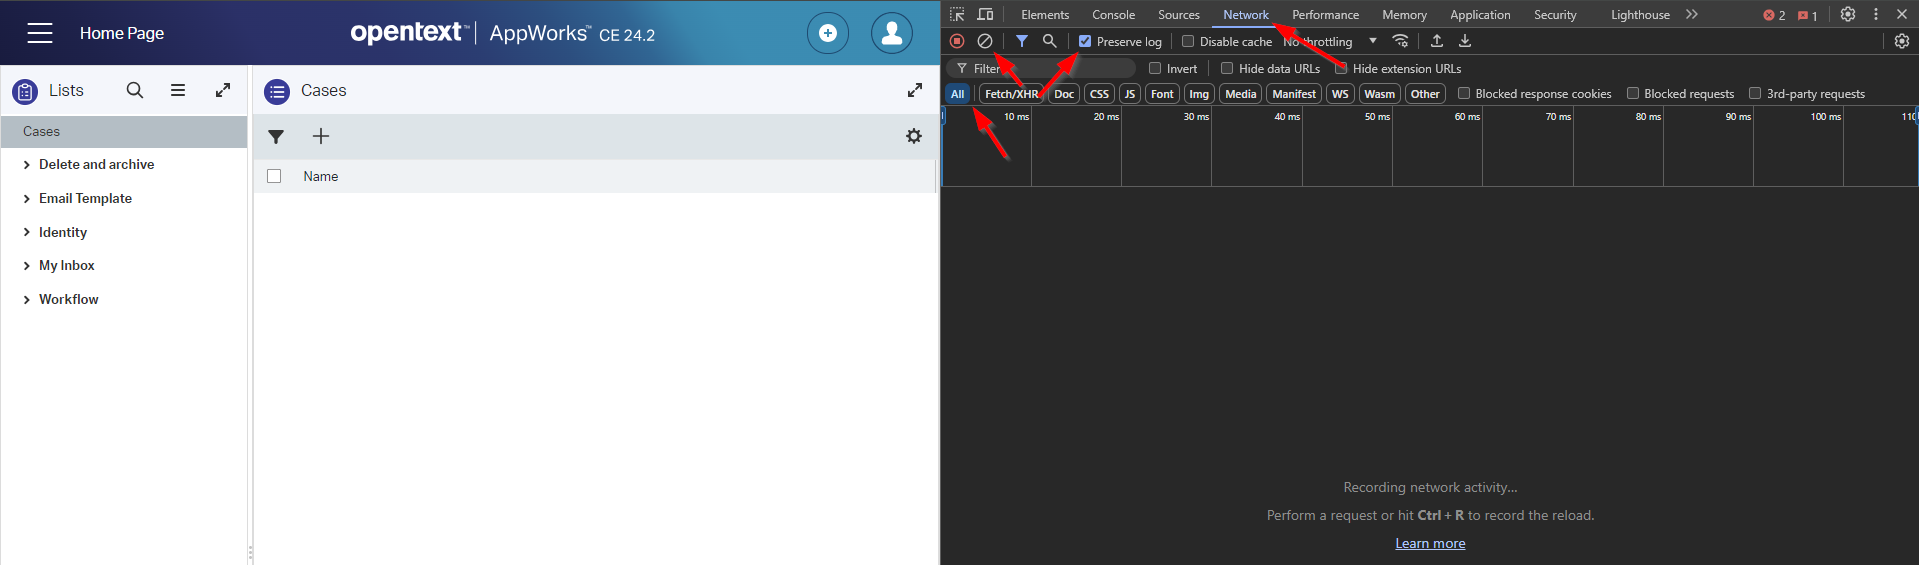
That’s in the ‘Network’ tab for ‘All’ type of requests with a ‘Preserve log’ and a ‘Clean’ before we start. Do a first refresh of the screen; Just to get a first result which should be fast as nothing fancy happens…right?
Next is clicking the ‘Create’ icon to instantiate a new ‘Case’…
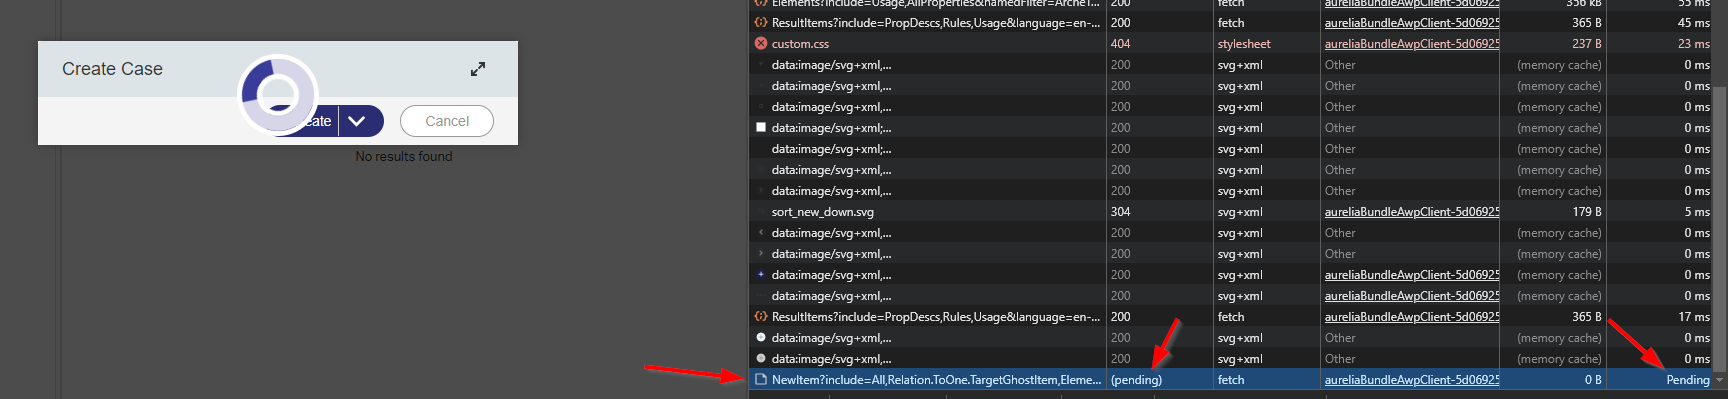
Your laptop fan will start to blow telling me we’re in the endless loop!
Let’s now first right-click the network traffic to get an option to “Save all as HAR with content”; This is my copy. What can we find here? Well, this file calls itself “HTTP ARchive” file; simply an export of the actions and corresponding requests you (as an end-user) did. Why is this useful? Well, sending this information to your administrator can inject the person with information to solve a certain performance problem. Will we find something in this JSON-data file for our issue? Well, in our case NOT as our last request is still “pending” (without a response to save!) and the rest is straightforward.
Still, it’s an interesting file; even more so when the total timings increase on the responses. That’s an indication something is wrong in the backend, or at least in the communication to the backend from the perspective of your end-user. Could be someone sitting/standing on the cat6-network cable? 🤣 (That’s an IT joke!)
What I also found is an interesting online tool to have this file analyzed:
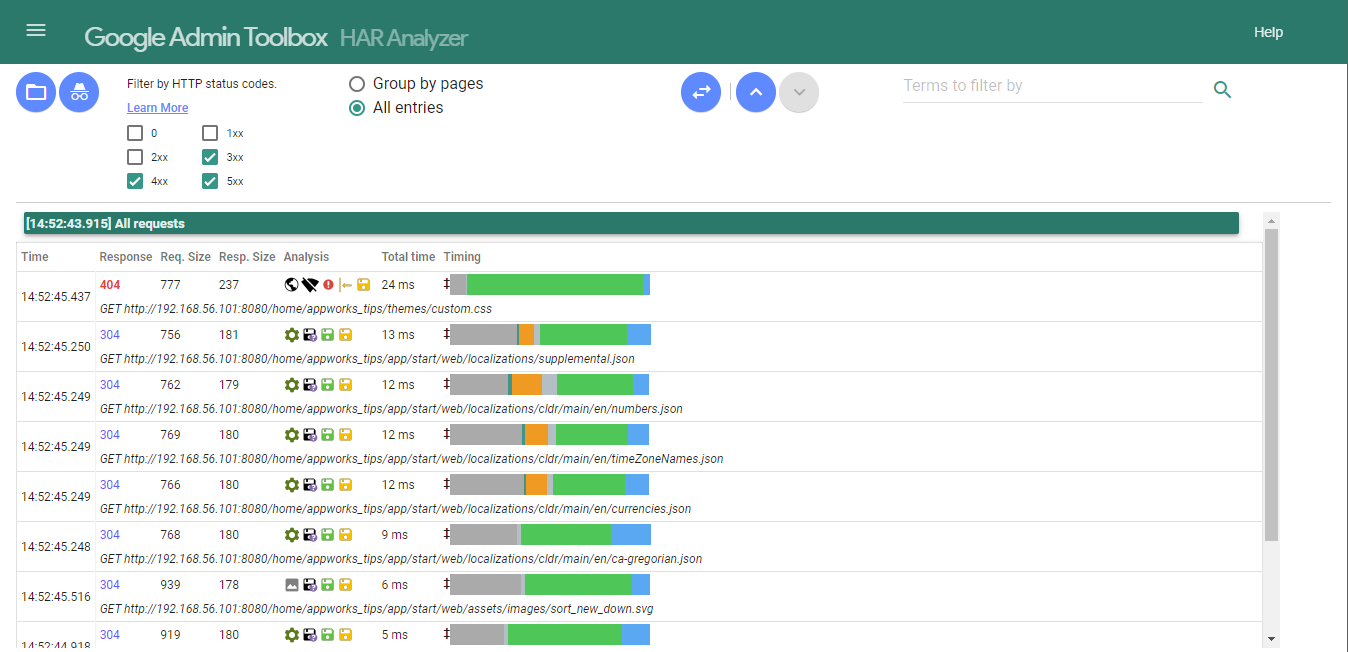
Nicely ordered by ‘Total time’ and viewing the error responses. Pick the fruits as we’ll continue to the next step to find our performance hit!
Java “jstack” and “jcmd” (in /bin)
Before we continue, let’s first agree on some ground rules when starting any tool:
- Run the same tool twice, once as a baseline measurement and once when the issue occurs. This way you can do a comparison between the two which makes things clearer.
- Make sure to restart your TomEE instance for a fresh empty-garbage measurement and fresh PID.
- Do this test outside office hours when the “regular” end-users have gone home already. That’s also the time when a “Cleaner” (Yeah, I read the book!) would strike; Just under the radar when the rest is sleeping!
- Limit access to the UI (with communication) for those smart people who sleep at the office!
Rules are in place, let’s restart TomEE first systemctl restart tomee to get rid of our fan-blowing VM for our endless BPM loop! Interesting to know (and maybe you didn’t notice), but from a new browser tab you can still access the UI!?…Well, that’s the power of multi-threading! Is it endless? Nope…I tried six browser tabs; each starting an instance of the ‘Case’, and the seventh kept white with the circling icon of the platform! Eventually, I did a reboot sudo shutdown -r now. 🤠
Other great reads on this threading stuff:
Once the VM is available again, we start with the baseline measurement. As input, we need the Process IDentifier (PID) of our TomEE instance. From a Linux perspective, you have several options:
1 | systemctl status tomee |
With this PID ready, we start the first command for our baseline (ground-rules are still in place…correct?): sudo jstack {PID} > ~/threaddump_baseline.dump
Now open your runtime with (let’s say) 3 tabs and do your tricks again on the performance issue AND quickly after triggering (and your fan starts to blow again) you do a second dump with: sudo jstack {PID} > ~/threaddump_issue.dump.
Here are my dump files:
You can start reading them but be a wise man and use a tool like “jstack.review” for this AND do a comparison:
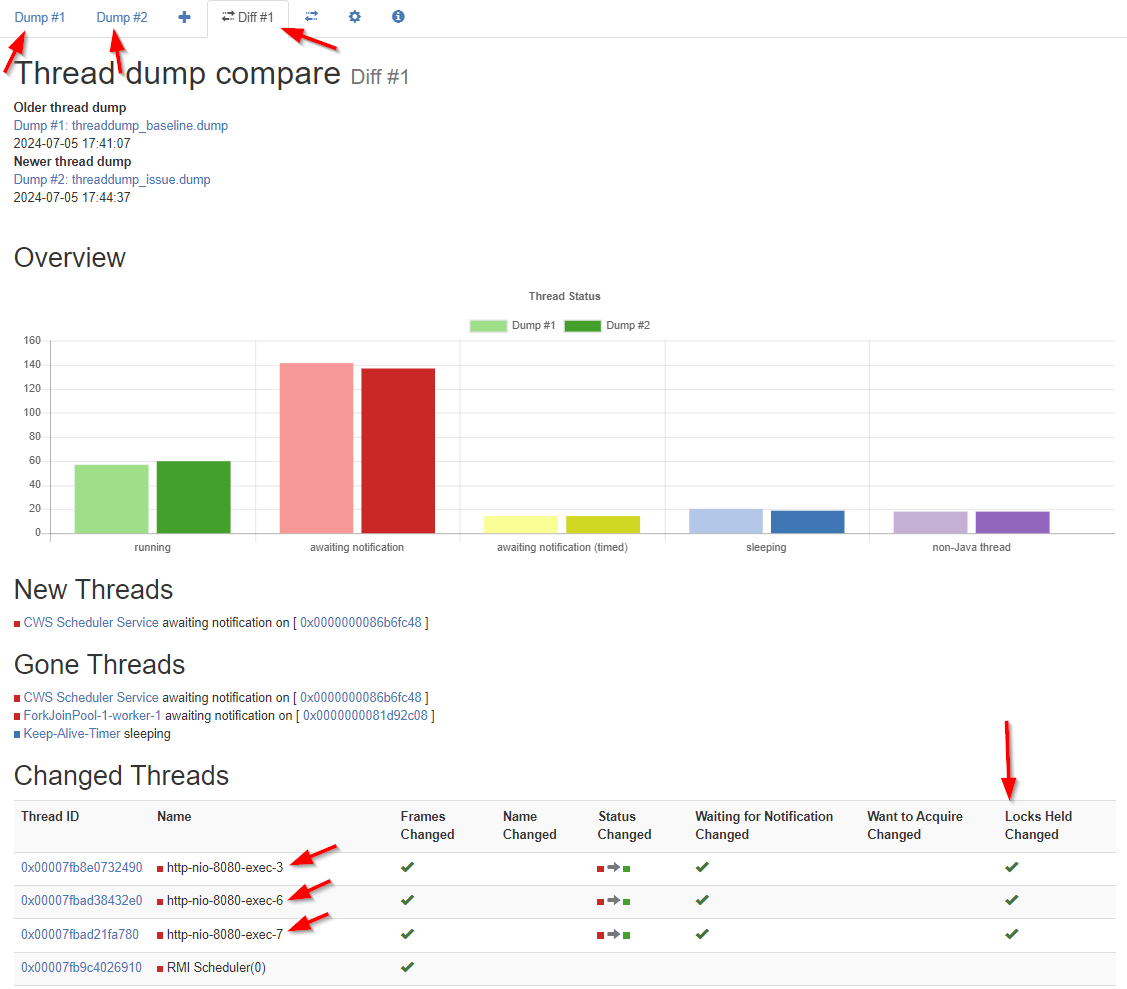
The image directly tells me instantly something gets a lock at HTTP level…dûh! You can click on the IDs to further investigate; you see great insights with stacktrace information on what is going on during your actions.
…
Finally, I also found out that jstack is old. The new jstack has the name jcmd; It can output an equal dump with a slightly different command:
1 | sudo jcmd {PID} Thread.print > ~/threaddump_baseline.dump |
At the end of this post there is a list for other input next to
Thread.print
A great “DONE” where we learned about some fascinating analytical tools for our AppWorks runtime UI. This of course works for any JVM and web UI type of interface and that is why you should be aware of the tooling. I was only aware of remote debugging on the JVM, but I’ll add these tools to my list as well. Have fun with it and I will see you in another great post on AppWorks Tips (don’t forget the list below to play with in your own spare time). 🍺
Don’t forget to subscribe to get updates on the activities happening on this site. Have you noticed the quiz where you find out if you are also “The AppWorks guy”?
1 | Compiler.CodeHeap_Analytics |
