
Hi there AppWorks fans,
Welcome to a new installment of AppWorks tips.
Imagine yourself being the administrator of a high-load production environment with hundreds of deployed process models in the main organization delivered from different departments working with the AppWorks platform. &^%@#$! starts to hit the fan at one of the deployed process models, and you want to customize the configuration, so it temporarily logs more details about the problem. You log in with your administrator account into the PRD organization (design-time) and you open the artifact “Deployed Process Models”…Now what? Have a search? Nope, not possible! Do an ordering on the BPM name? Nice try but will only work for the current page items!? Click through all the pages one by one like a monkey hoping to find what you’re looking for? Well, that’s the power of low-code! Build it once, and don’t look back. 🤣
That last part is off course a joke, but you don’t want to know how often I see people clicking endless from one page to the next page to find the BPM causing troubles!? Can we do better? My friend…Off-course we can do better! That’s the power of (micro?)-services! 🤔
Let’s get right into it…
First a quick view of what we like to do here. Open the artifact “Deployed Process Models” (you must have the Administrator role applied):
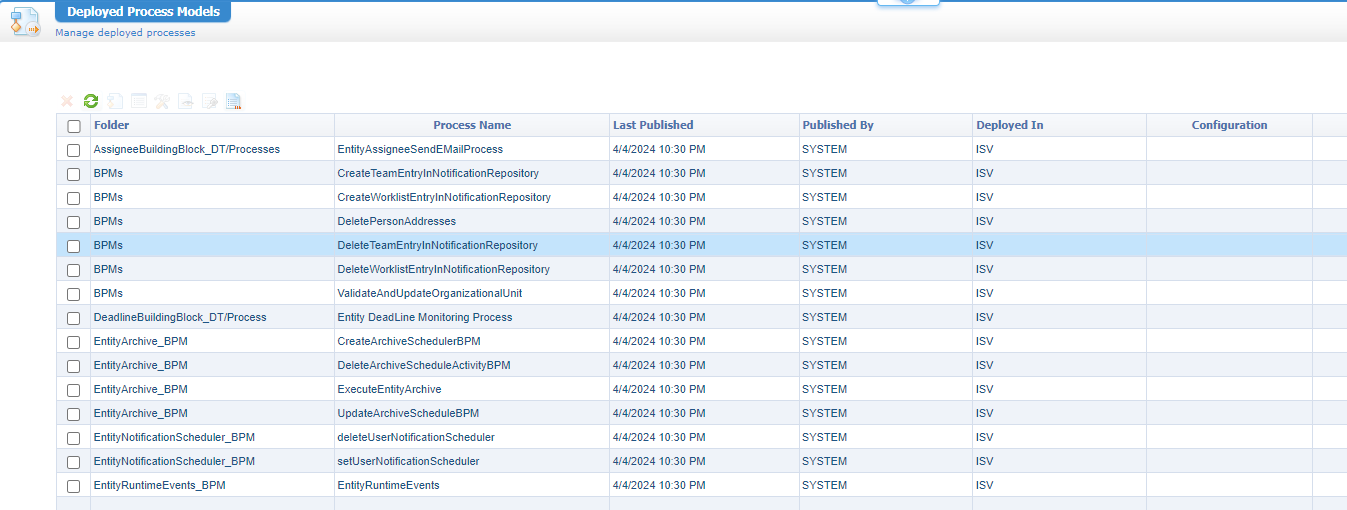
My list is short because of a clean environment, but in a heavy loaded environment this looks different (with more pages!)
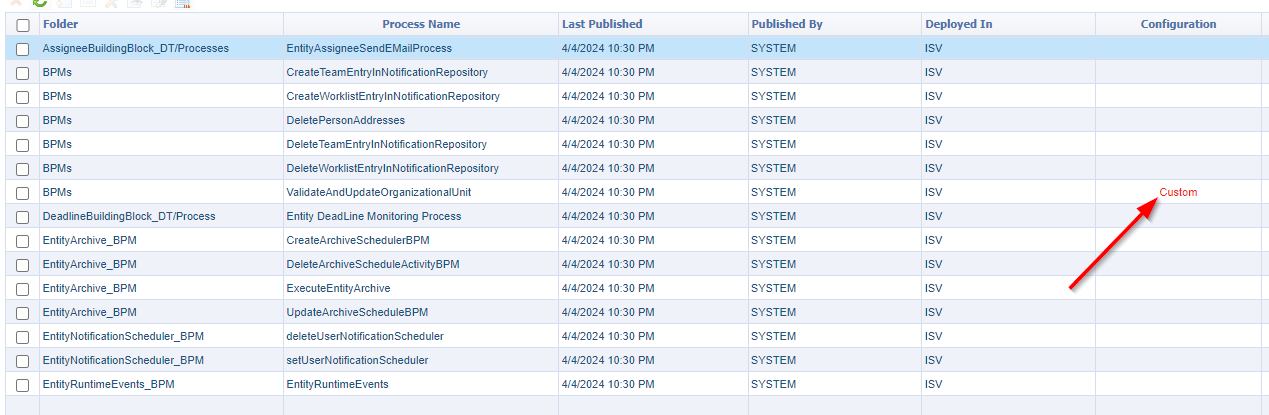
Pick a BPM that you can right-click and set a specific custom monitoring level (under ‘Configuration’ > ‘Customize’):
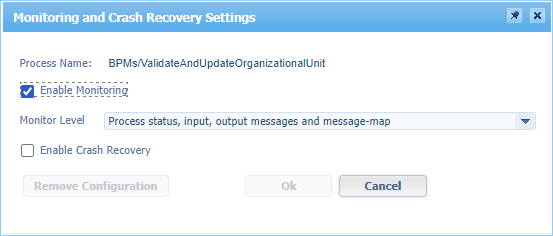
After the change you see it in the list of process models as “custom”. You can remove it again from the same context menu!
Don’t forget the removal of the configuration once you’re done as you’ll not be the first one keeping logging levels too high with a quick increase of database tables sizes as a result!
How can we do this “setting” and “removing” in a quicker way…especially once there are 100+ BPMs available to browse through? Well, open the Chrome developer tools <F12>, tune in on the ‘Network’ tab, set the configuration again on a BPM, and watch…
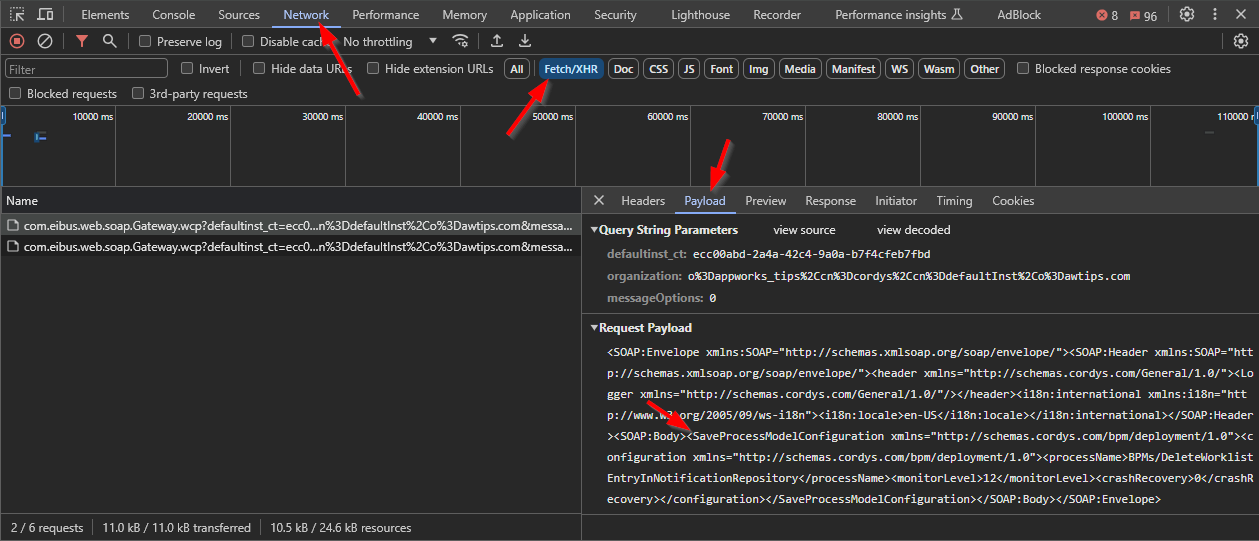
AHA!!!! Let’s put this in a better view (cleaned from namespaces and non-info!):
1 | <SaveProcessModelConfiguration> |
And watch the removal of the configuration:
1 | <DeleteProcessModelConfiguration> |
Or the retrieval of the full list:
1 | <GetAllProcessModels> |
Don’t ask me about the
8inmaxRows=99989? Is there a story behind it? Is it a typo? Was it a joke? 🙃
Right…What can we do with this information!? Well, let me share you another interesting screenshot:
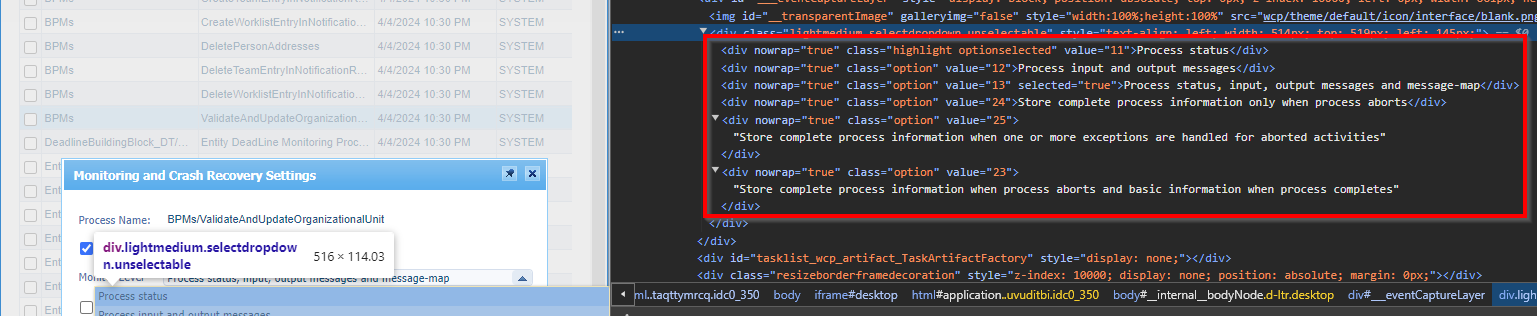
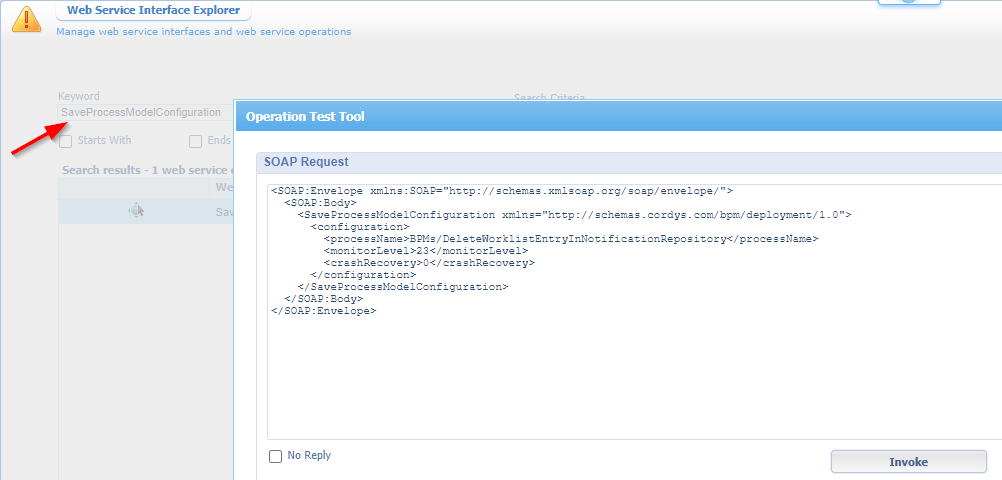
Watch those value numbers closely and have a look again at service call SaveProcessModelConfiguration with the artifact ‘Web Service Interface Explorer’:
NO WAY!?!?!? 🤥
So, when we create a new BPM, start an instance, and watch the PIM:
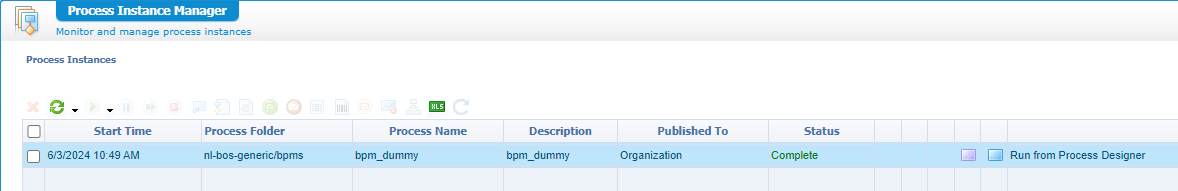
We can now do an update on monitoring level with a call like this:
1 | <SaveProcessModelConfiguration> |
NICEEEEE…So, there is no need to jump into the “Deployed Process Models” artifact…Unless explicitly required for other reasons!? Whatever that may be…Add a comment below.
…
Let finish with some examples for the GetAllProcessModels
1 | <!--Only models within current organization--> |
1 | <!--Independent Software Vendor BPMs (third-party!)--> |
1 | <!--Extra details--> |
1 | <!--Extra details with useless extension--> |
I retrieved the last
detailselements via a quick remote JVM debug session, but let’s quickly forget it. I could also only find XPath support onmodelID!?
For my (and your) reference on the file:bpmengine.jar
In class:com.cordys.bpm.runtime.repository.BizProcessRepositoryManager.getAllProcessModels(...)
Just a final thought for you as an administrator; What you can do with the output of these service calls is watching if any deployed BPM has an element <monitorlevel>13</monitorlevel> which should raise alarm bells because of the including messagemap that can cause big log tables/files!
Comment me on your thoughts on this “DONE” post and let me know if this will be your last time of endless searching in the “Deployed Process Models” artifact. Pick the fruits and share the thinking…I see you; next week! 😎
Don’t forget to subscribe to get updates on the activities happening on this site. Have you noticed the quiz where you find out if you are also “The AppWorks guy”?
