
Hi there AppWorks fans,
Welcome to a new installment of AppWorks tips.
For this week (and the last one for this year), we have a high-valuable skill to share. It’s all about finding your way when things start to fail on the platform. This blog site already explained you about logfiles, log settings, and the PIM artifact. Only, when things really, really start to fail, and you end up with an unexplained stack trace in you logging, it’s time to debug the code…Line by line within the back of your mind the experience we have with the platform and the solution build on top of it. So, let’s start with a list of ingredients we need for this post:
- Build an error scenario…an easy task…right? 😏
- Throw your error (and monitor your logging on the stack trace)
- Check the responsible class file and corresponding row number where it happens
- Find the related JAR/Class file and save it locally
- Place Tomcat in remote debug mode with JPDA
- Create an empty Java/Maven project in IntelliJ
- Add the JAR on the classpath of the project or as dependency in the pom.xml (with a system reference)
- Open the class from the external libraries list (IntelliJ is smart enough to decompile it)
- Place a ‘Method entry’ debug point on the related method call
- Connect to the remote JVM from your IDE
- Throw your error again and watch the magic passing by!
With all the ingredients in place, we can take off…
Let’s get right into it…
The first step is to start failing at something (and eventually learn from it)…We as low-code developers always create everything 100% in perfection (😇), but when end-users (or better…the test-team) starts to play with your crafted solution they always find something to break! For this post we want to break something, so it will deliver us a nice stack trace in the logfile of the AppWorks platform to continue playing with.
How hard can it be? Well, start your VM, login to your favorite organization with (in my case) the account awdev. Now open the artifact ‘iHub Connection Manager’ (just because we can) and click the test button:
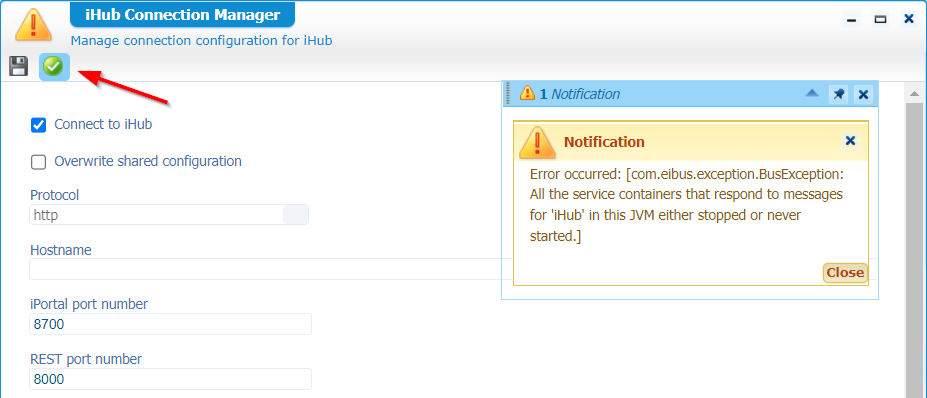
There you have it…You can find the stack trace for this error on the AWP server: sudo tail -999f /opt/opentext/AppWorksPlatform/defaultInst/Logs/Application_Server.xml.
It looks like this (cleaned from overhead information!) including the important ‘Caused by’ line:
1 | <log4j:event logger="com.eibus.web.gateway.SOAPTransaction" timestamp="1666339772889" |
Yes, I know that we know what’s going wrong here, but that’s not the point of this post…Keep on reading!
So, now what?…Well, imagine yourself that you don’t have a clue what is going wrong here, and you would like a deep dive into the code for further investigation on the stack trace!? Would that be possible? Even if we don’t have the sources of the platform available? WHAT!? Yes, my friend…Don’t worry, it’s possible with a trick that will blow your mind!
But first…Where is it going wrong? That’s our ‘caused by’ and when you take a closer look it’s just a service call via the AWP GatewayServlet class, managed by the WebApplication class, and eventually send by the Middleware class. The great question is here where to find these classes? Well, for that (I’m on Unix) I always use this command:
1 | sudo find /opt/opentext/AppWorksPlatform/defaultInst/ -type f -name '*.jar' -print0\ |
I also figured out a faster command:sudo grep -l -R --text com.eibus.transport.Middleware /opt/opentext/AppWorksPlatform/defaultInst/ | grep '.jar'.
This last call simply searches for a corresponding text; the first call searches for the real class file in the JAR.
For windows enthusiasts, there are also JAR file search tools available:
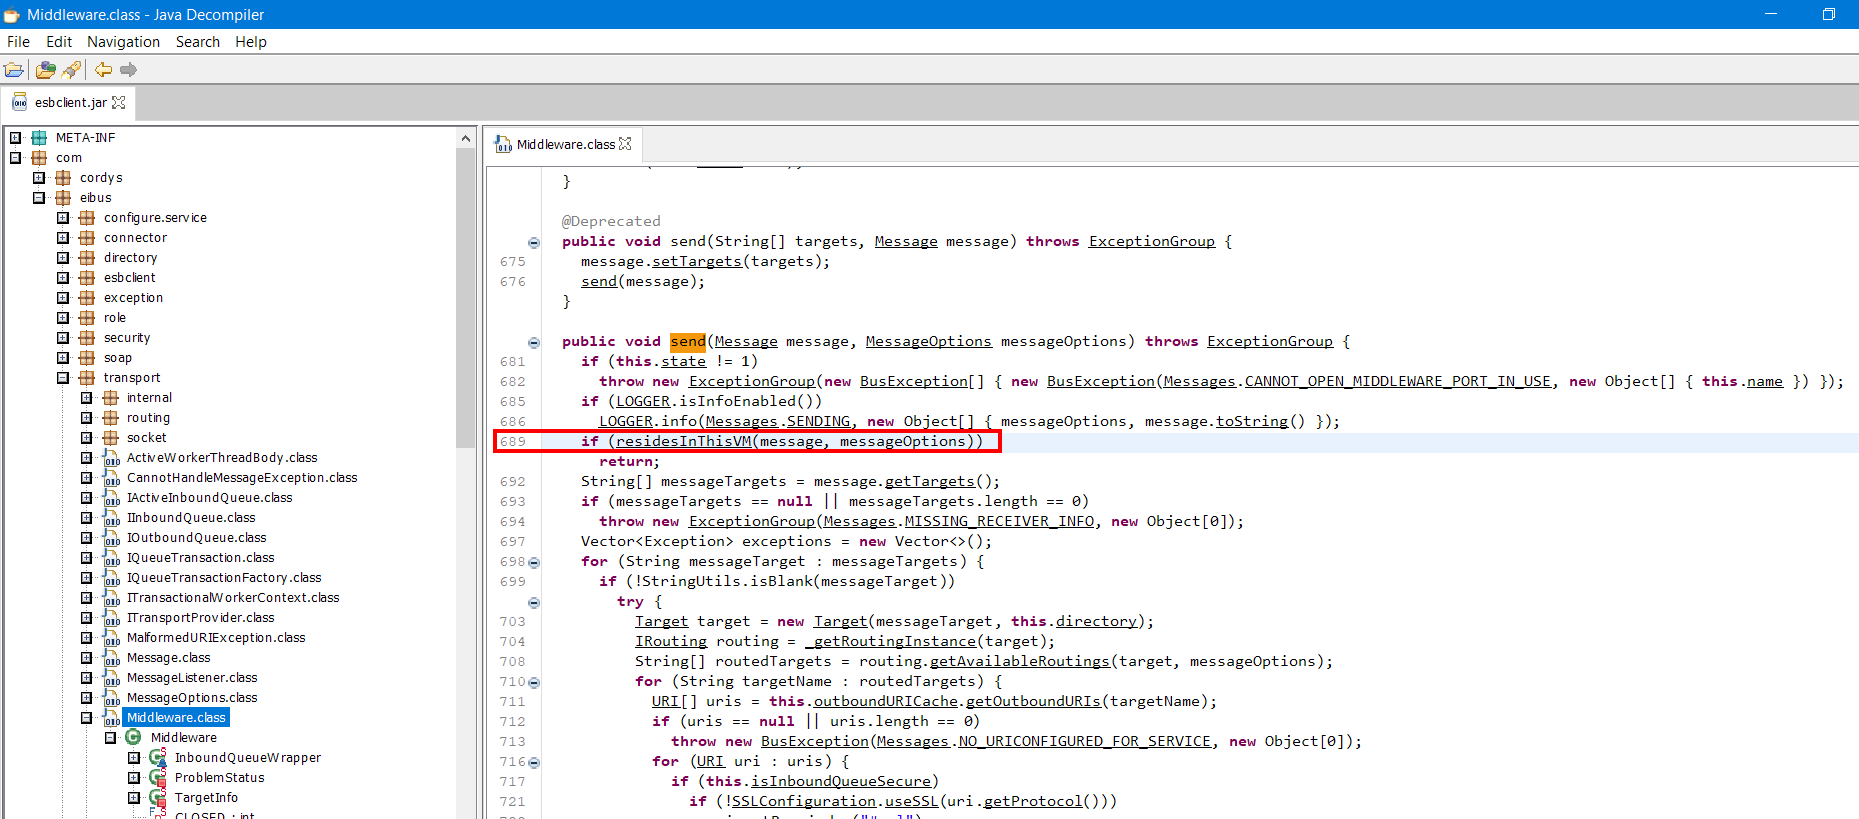
Both my search commands receive this jar file /opt/opentext/AppWorksPlatform/defaultInst/components/esbclient/esbclient.jar. Save this file locally (if you haven’t already) and decompile the file with JD-GUI. You will have a clear view on the Middleware.send() method of our stack trace with line 689 calling the residesInThisVM() method (also in the same class!):
So, would it not be great to have a debug breakpoint available on that line and walk through it? YES!…Tell me, tell me…Only, before we can do this we need to run our TomEE instance in debug mode. Apache made this easy via the Java Platform Debugger Architecture (JPDA) and with simple command we can make it happen on our Unix VM:
1 | systemctl stop tomee |
JPDA is for JVM debugging and JMX monitoring!
So, your AWP should be available again, but this time in debug mode which makes us developers very happy…Watch this…
I always work with IntelliJ which is my favorite IDE as Java developer. After you start it up, you get a ‘Welcome’ screen where we just create a new Java project:
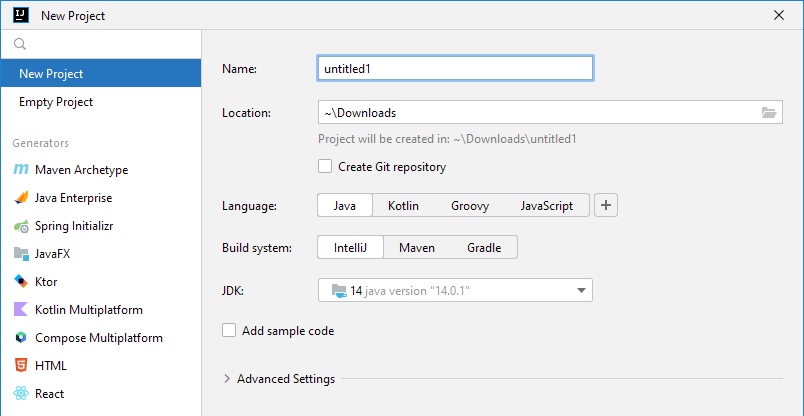
You can also create a ‘Maven’ project and get a grip on any dependencies, but it’s not required for our use-case! At a customer I would recommend to always use a Maven project for any Java related topic on the AppWorks platform.
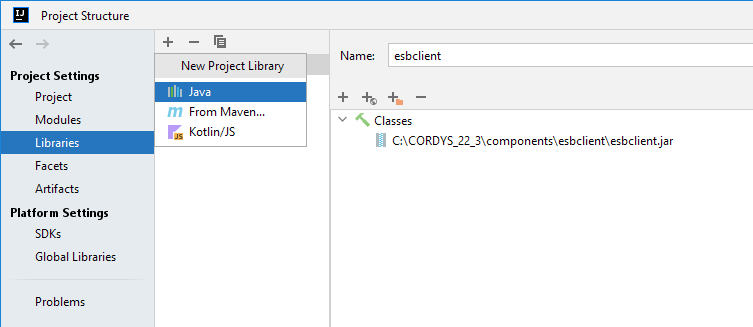
Open the ‘Project structure’ from the ‘File’ menu and add the JAR library we found on our server, related to the stack trace, and saved locally:
When we’re back in the project overview, you can open the ‘External Libraries’ section of the project and open the Middleware.class again (like we did with JD-GUI!). IntelliJ is smart enough to decompile it for you…How nice!
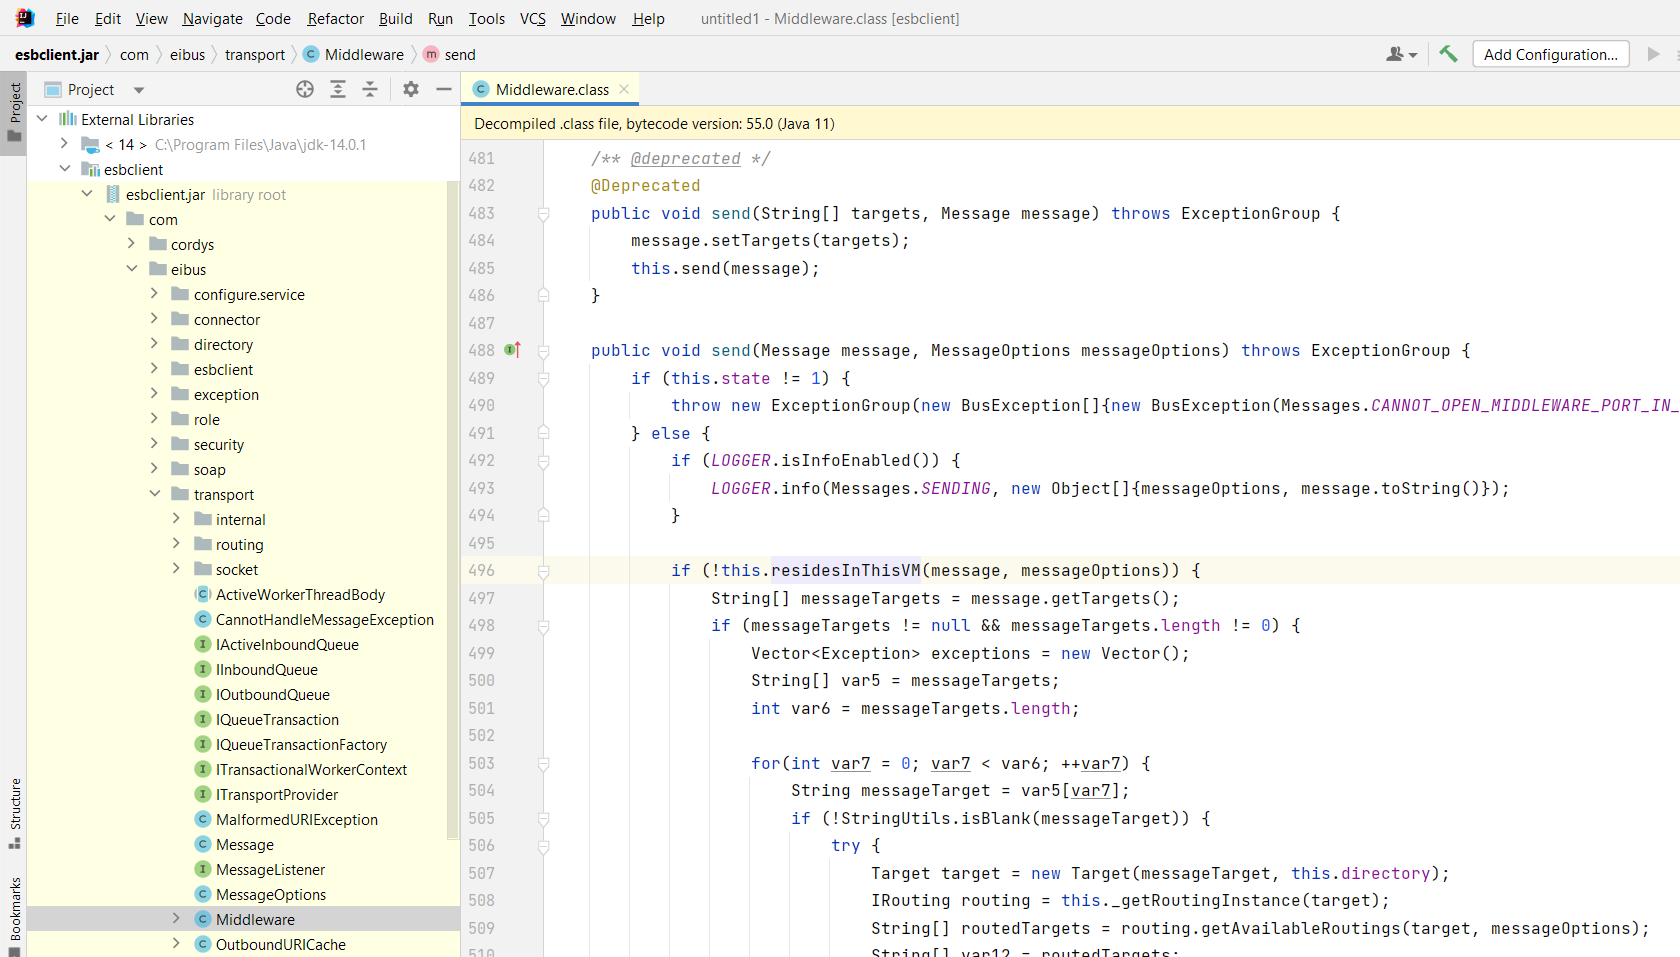
Now watch those line numbers again! Do you see any difference? Yes, the residesInThisVM() is now on row number 496! This does not match the 689 line of our stack trace and because of that it’s not possible to set a debug breakpoint at line 496. Also, a breakpoint at line 689 is not useful in this case. Now what? Well, you can also set a so-called ‘Method-entry’ breakpoint!
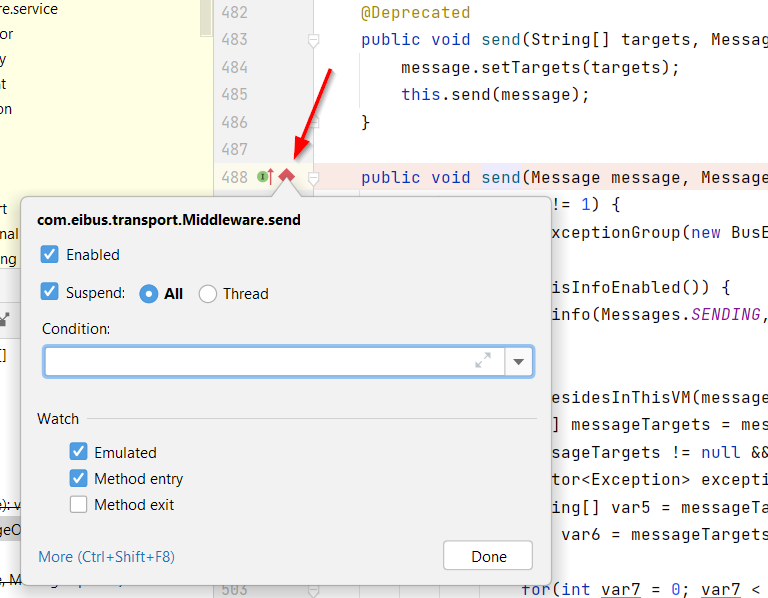
Nice feature!…With this breakpoint in place, it’s time to connect our IDE to our remote debuggable TomEE instance…From the ‘Run’ menu, open the ‘Run Configurations’ screen. Here you can add a new ‘Remote JVM Debug’ configuration; Like this:
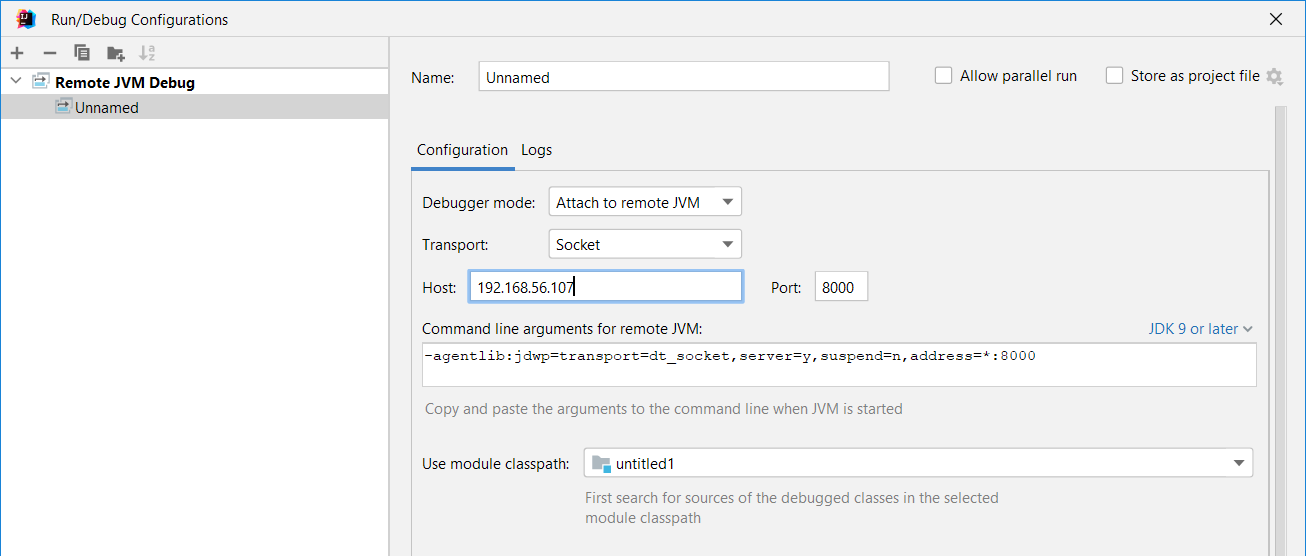
After saving it, you can start a new remote ‘Debug’ session in the top-bar of IntelliJ. If all is fine (including firewall pass through on the server!), you should receive a message on a successful remote connection:
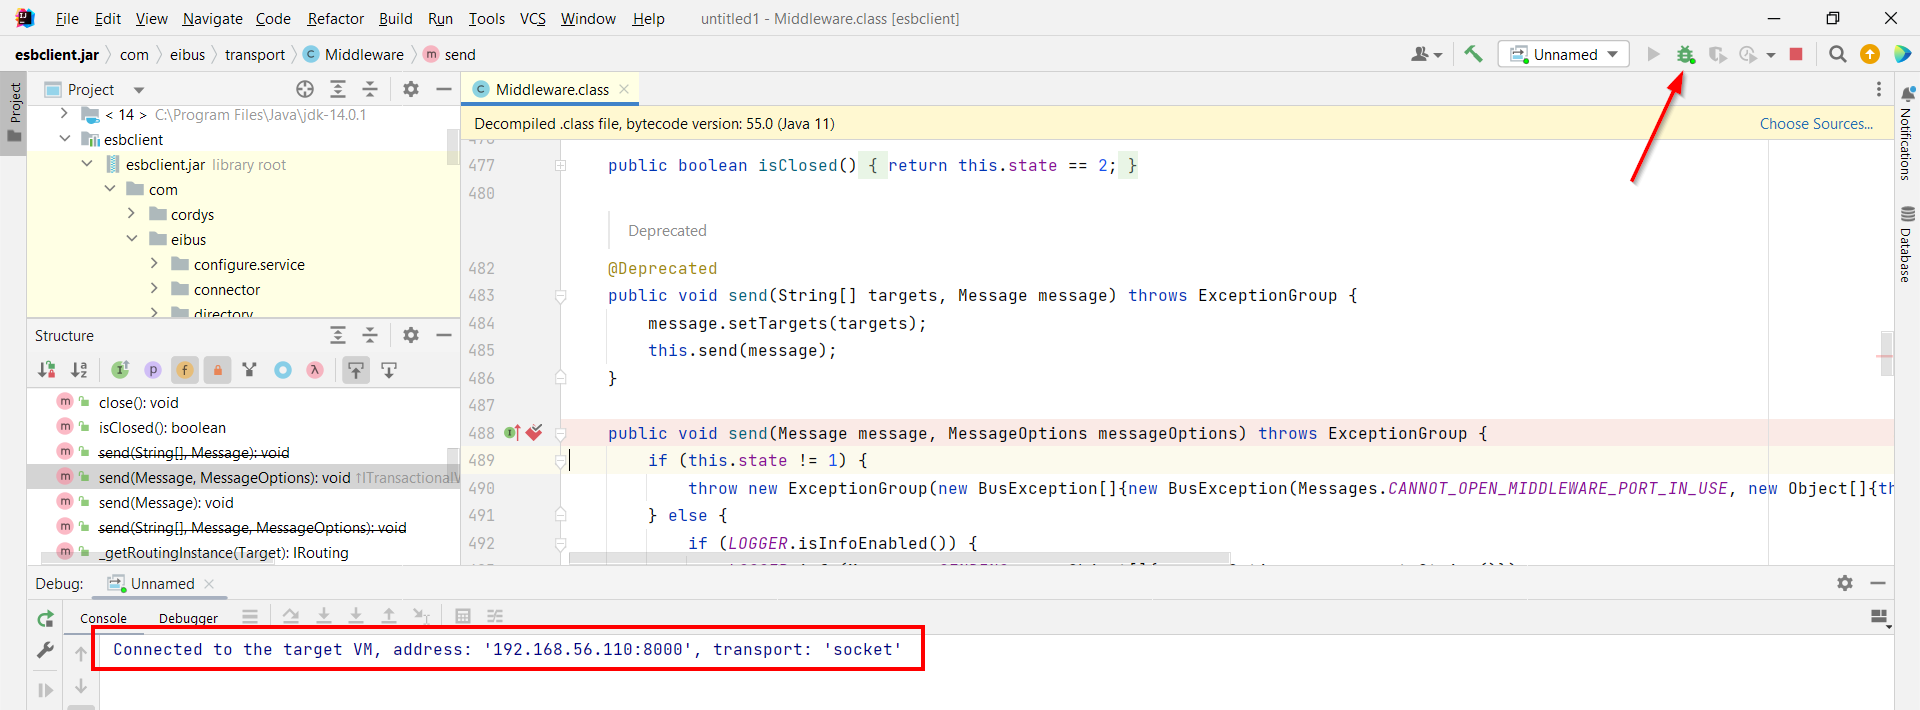
You will see that your debugging point gets triggered already! That’s because the
Middleware.send()method is the heart of our platform which is triggered too by internal tasks. You can fix this by adding a condition to the breakpoint like thismessage.getTargets()[0].contains("iHub").
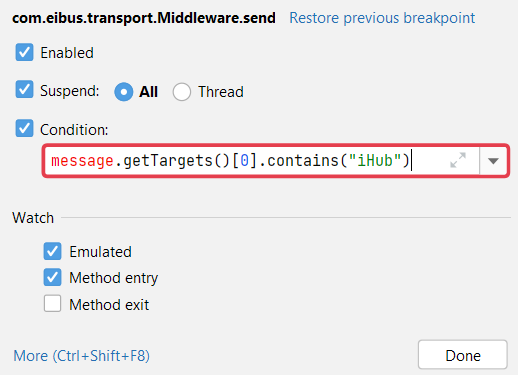
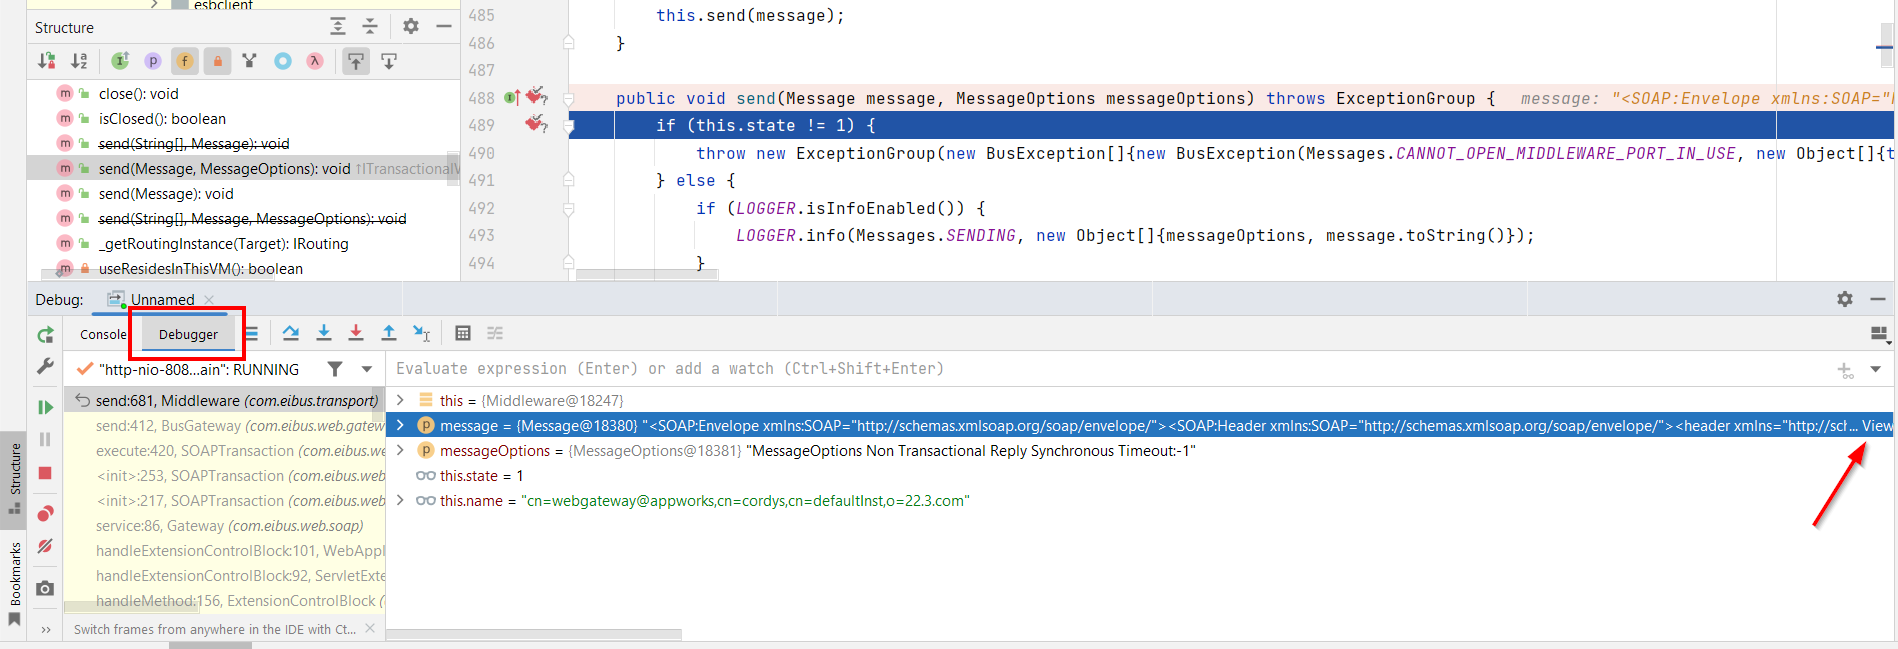
So, move back to your error initialization (the test-button in the iHub Connection Manager artifact)…Hit it, and watch what happens in your IDE! It will “halt” on-method-entry, and you can already view some interesting data:
Now what? Well, you have a ‘Blue pill, red pill’ option to make:
- BLUE pill (
<F9>); the story ends, you wake up in your bed and believe whatever you want to believe! 😵 - RED pill (
<F8>); you stay in wonderland, and I show you how deep the rabbit hole goes. 🤓
Well, comment me what choice you’ve made!? For me, it’s already a high-valued “DONE” on this post where we provided guidance to your next level experience on the AppWorks platform. With this information any stack trace is manageable again with great new insights. Make it your best debugging weekend and have yourself a great turn of the year…I see you in another great topic in 2023!
Don’t forget to subscribe to get updates on the activities happening on this site. Have you noticed the quiz where you find out if you are also “The AppWorks guy”?
