
Hi there “Process Automation” fans,
Welcome to a new installment of “Process Automation” tips.
Last week, we saw our first Grafana dashboard passing by nicely embedded in an entity layout reading the metrics of a JSON exporter. Great stuff, but there is more data available to explore via metrics.
It’s time to continue our journey on Grafana connecting the OPA database with a fascinating exporter! It was not the intention to do it with this exporter (see below), but with new knowledge, you get new insights which brings you to new areas of expertise.
Let’s get right into it…
BUT…First some upfront insights on directions you do NOT need to go to!
Last week we learned about the “JSON exporter”; Interesting stuff and works great. This post will dive into other data (in the database), and I was just wondering how to grab this information! First I thought about calling HTTP SOAP services over the “Blackbox exporter”, but with all the authentication over OTDS it would be a nightmare…We need to be closer to our target which is our database! So, searching brought me to the “Postgres exporter”; Super interesting, but I’m totally missing the point here as this exporter has a different use-case which is monitoring, alerts, and performance tracking of the DB itself where I want to visualize real application data (our entity-, bpm-, and lifecycle-instances!)
A moment of “AHA” brings me this question: Why don’t you simply use the Postgres data source like you also got your hands dirty on the Prometheus data source!? WHAT! Yes, as straightforward as that! #OMG…Couldn’t you tell me this in the first place!
So, now you know…First think, then act; I also do it sometimes the other way around! 🙃
Another valid question would be: Do we still need the JSON exporter!? As you can find some of these details in the database…correct? Well, not exactly!? I did a quick research and each service container has a socket URI with a port number and the platform internally checks whether it’s up or down; Probably with some kind of pingy-thing. Not for now…We keep it with other interesting SQL statements from a Postgres perspective.
I think it’s about time to explore some things now…
…
WAIT…STOP!! My great friend ChatGPT comes to the rescue with another approach/advice! Querying the DB from a Grafana standpoint adds load (with a scheduled query) to the tables, does not build a history in a time-series DB (in Prometheus), AND the post after this one will implement alerting from a Prometheus point of view which brings us closer to the metrics fire. So, what we need is the creation of a custom exporter for my specific “counter” queries; This sounds better and is more fun to do! Ok, but a custom exporter still needs to run a query over a scheduled period! Right? Yes, but that’s pure counters which is cheap for performance.
…
So, now the target is set for this post on creating a custom Python exporter with the help of ChatGPT to generate metrics data out of our queries as input for Prometheus…
Interesting queries to play with
Before we start building, we first make sure to get some interesting SQL queries to play with. For this we’ll increase the log details on our Postgres instance with these commands:
1 | sudo vi /var/lib/pgsql/data/postgresql.conf |
Once logging is ready, we can simply do some interesting actions in the UI of OPA that eventually will evolve into SELECT-statements at DB log-level. Make sure you have some BPM instances available and get the overview of the PIM (the consolidated view) generating a statement like this:
1 | -- BPM instance overview of the PIM! |
You can also get the “all instances” view and filtering out on “ABORTED” state with a statement like this in the log:
1 | -- Count of ABORTED BPM instances |
That’s the same for entities with a lifecycle. Create instances in runtime, watch the CIM and see this passing by:
1 | -- Case instance overview of the CIM! |
This is what you get when you look further down into the CIM:
1 | -- Case instances count per state |
Or when you start the further filter down on “ABORTED” state:
1 | -- Count of ABORTED Case instances |
An easy one would be an entity with “Is active” Boolean property that we can query like this:
1 | -- Count of "active" case entity instances! |
You can go on and on like this and if you use the Count() function it’s a light-weight impact on your database. Let’s continue to see how we can call this in a custom exporter.
A custom exporter
Don’t panic on the word “custom” as it’s easy to do…Especially with a little help from our AI friends. First we need to prepare our VM with some “Python” software and relevant packages:
1 | # Install Python and Pip (if not installed) |
Once all is fine, continue creating the script: sudo vi /opt/postgres_custom_exporter/postgres_custom_exporter.py
This is the content (with 2 queries) you can use (and extend yourself!):
1 | from prometheus_client import start_http_server, Gauge |
You see me using hard-coded DB credentials; Good for now, bad for production! Make sure you receive them elsewhere; Like environment variables. AI can generate examples for it…I leave it with you.
You see it’s no rocket science…I don’t have any Python skills and understand what happens! Next step is making it executable and run it:
1 | # Make it executable |
You can now access http://192.168.56.107:7878/metrics and check for metric value app_active_cases_total and app_aborted_bpms_total!
With this in place, update your Prometheus scraper config in sudo vi /opt/prometheus/opa_config.yml with a new job custom_postgres_app_metrics and a restart of Prometheus.
1 | global: |
You can now also find app_active_cases_total and app_aborted_bpms_total from a “PromQL” standpoint…AND we can now also use this in Grafana like we saw last week with an end-result like this:
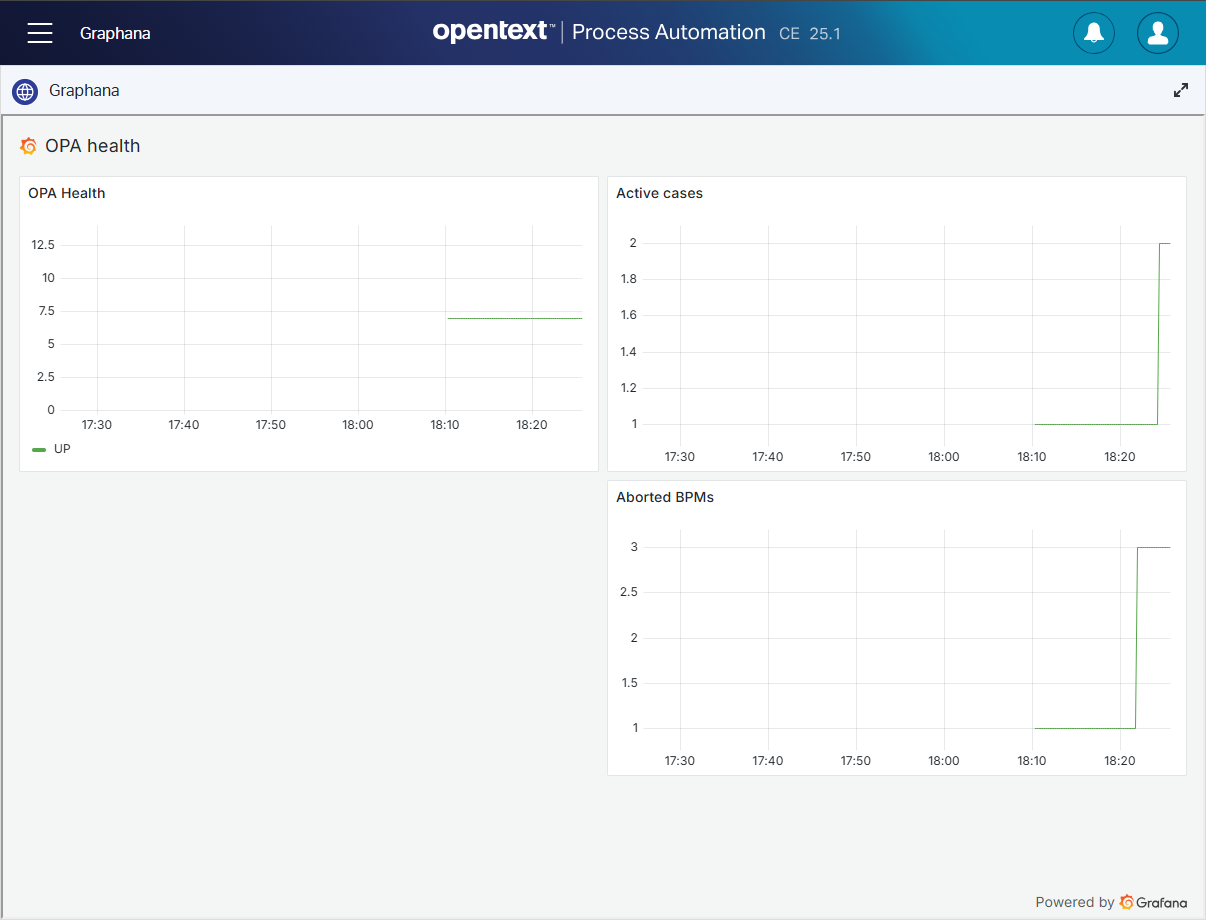
Victory!! 😍
We can of course create a Unix service wrapper around our script, but I leave that task with you (example here)…Again, it’s no rocket science!
You see how easy things can be with a little ReThinking, AI brainstorming, and simply trying the result; It’s a “DONE” where we learned about creating our own metrics exporting in Python, including scraping the data in Prometheus, and consume it further into our Grafana dashboard. Have a great weekend; We continue our journey on alerting with Prometheus (not via Grafana!) next week.
Don’t forget to subscribe to get updates on the activities happening on this site. Have you noticed the quiz where you find out if you are also “The Process Automation guy”?
