
Hi there “Process Automation” fans,
Welcome to a new installment of “Process Automation” tips.
Did you notice the subtitle of this post? “Like a DevOps ninja!” 😎 Well, that’s what you get from ChatGPT when you let it generate clickbait type of titles (and subtitles)…They always make me laugh; Is this really the world going upside down? Is it really the world attracting people to your website? Let me know in the comments if it helps!? For me, it’s not that interesting, but I’m also just a “techie” exploring/broadcasting the world, writing about the OPA platform, so you gather insights. I guess that’s more important than fancy titles…
Enough of all the world complains…We have fascinating stuff to do for our posts…It’s ‘Grafana’ time (incl. ‘Prometheus’ and relevant “exporters”)! It all sounds like great gods, but it’s just monitoring software over collectable data. Or as “Grafana” would say: The open and composable observability platform!…Clearly someone from sales! 🥳
Why do we want/need this? Well, in “the arena” of services (internal and external) it’s incredibly important to get informed as quick as possible before further damage occurs once a service goes down. The only way for this is monitoring and alerting when damage happens, but it’s not just pinging end points! It’s also important to monitor your BPM instances, case instances, entity instances, or any other highly sufficient list you want to keep track on. Especially from an administration team perspective!
I split this Grafana post into 4 separate posts. This post, where we will install and prepare everything for a good initial understanding. Next, we do a post about Grafana dashboards. The post after it, we find ourselves a way to monitor SOAP call responses (like the BPM summary) to put it into metrics data for further Grafana consumption. Finally, we’ll have a look at the alerting mechanism to get ourselves informed.
…
What can you do with ‘Grafana’:
1 | Visualize your data, optimize your performance |
OSS stands for “Open-Source Software”; Grafana also has a cloud edition with a selectable region as geographical storage location for data. Not for this post, but just that you are aware of it! I just want to be in self-control and learn about the backend which can be a challenge at cloud providers, but I do get the concept of course, and understand the demand from companies.
What can you do with ‘Prometheus’ as Monitoring system & time series database…Sales again?:
1 | From metrics to insight |
It’s time to get our hands dirty on our VM; The same VM that has the OPA platform available.
Let’s get right into it…
My VM runs RHEL (Linux) which requires some bash commands to run from the terminal; I use MobaXTerm, but any terminal will do.
Here you can also find the first commands; I go for the non-recommended OSS edition; It’s minimal, less overhead, no telemetry, and no license stuff.
sudo yum install -y https://dl.grafana.com/oss/release/grafana-11.6.0-1.x86_64.rpm
Also, this resource is great to follow!
For the default enablement, continue with these commands:
1 | systemctl enable grafana-server |
After this, you can browse to this URL: http://192.168.56.107:3000

Username and password are by default
adminwhich you can reset on first login or skip it to use it as is! #SECURITY
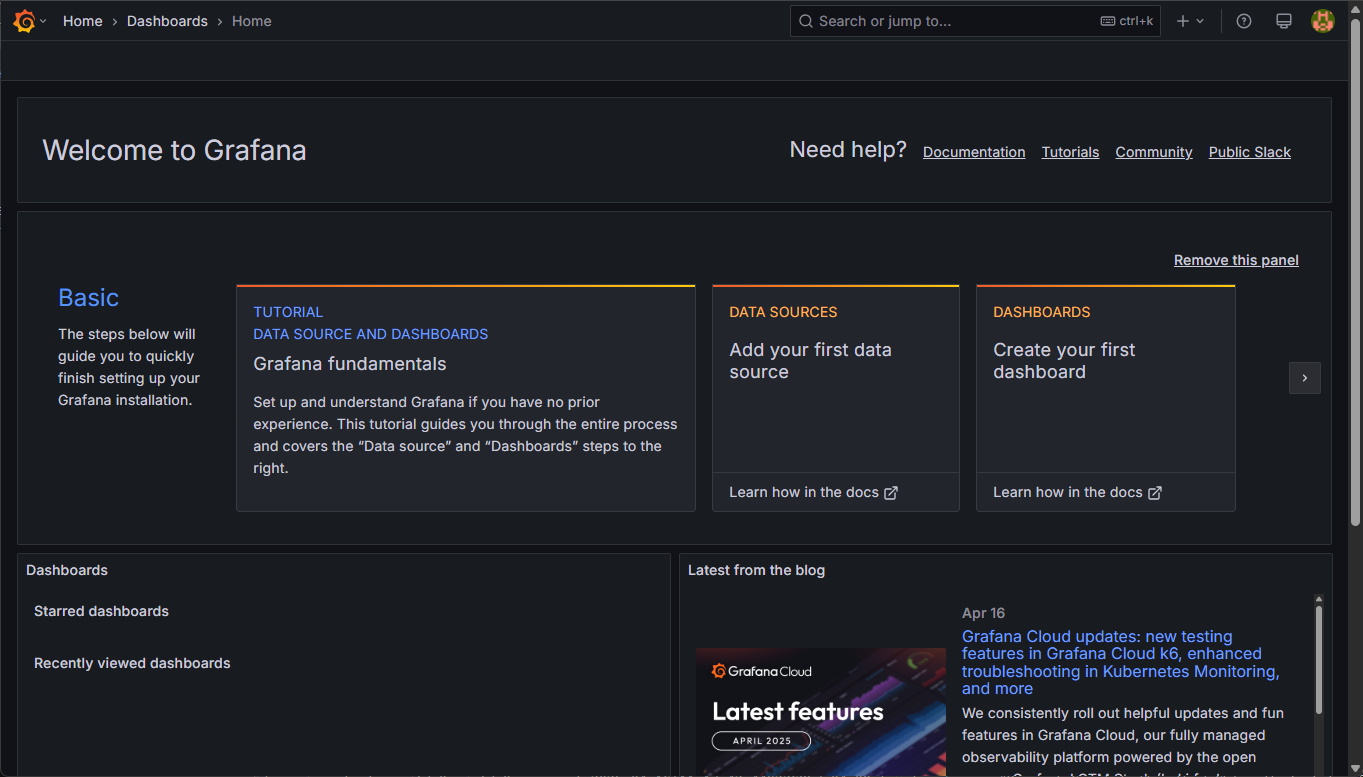
This is your screen after login:
Notes:
- You can view the logging via:
sudo tail -999f /var/log/grafana/grafana.log - You can change settings via:
sudo vi /etc/grafana/grafana.ini; Like for example the default port3000!
Do your first exploration; It’s no rocket science, and we will get back to this in these “Grafana” series of posts!
Installing Prometheus
You can get it from here, and you can use the commands below to head start it all (or follow this tutorial); I go for the LTS release:
1 | wget https://github.com/prometheus/prometheus/releases/download/v2.53.4/prometheus-2.53.4.linux-amd64.tar.gz |
This is the starting config for opa_config.yml
1 | global: |
Start Prometheus (incl. the config file) with sudo /opt/prometheus/prometheus --config.file=/opt/prometheus/opa_config.yml and watch the log in the console!
You can now open the UI at http://192.168.56.107:9090/graph and watch the possible metrics at http://192.168.56.107:9090/metrics.
From the expression editor you can execute a query (a “PromQL”) on metric value prometheus_target_interval_length_seconds for some first results (incl. some tweaks):
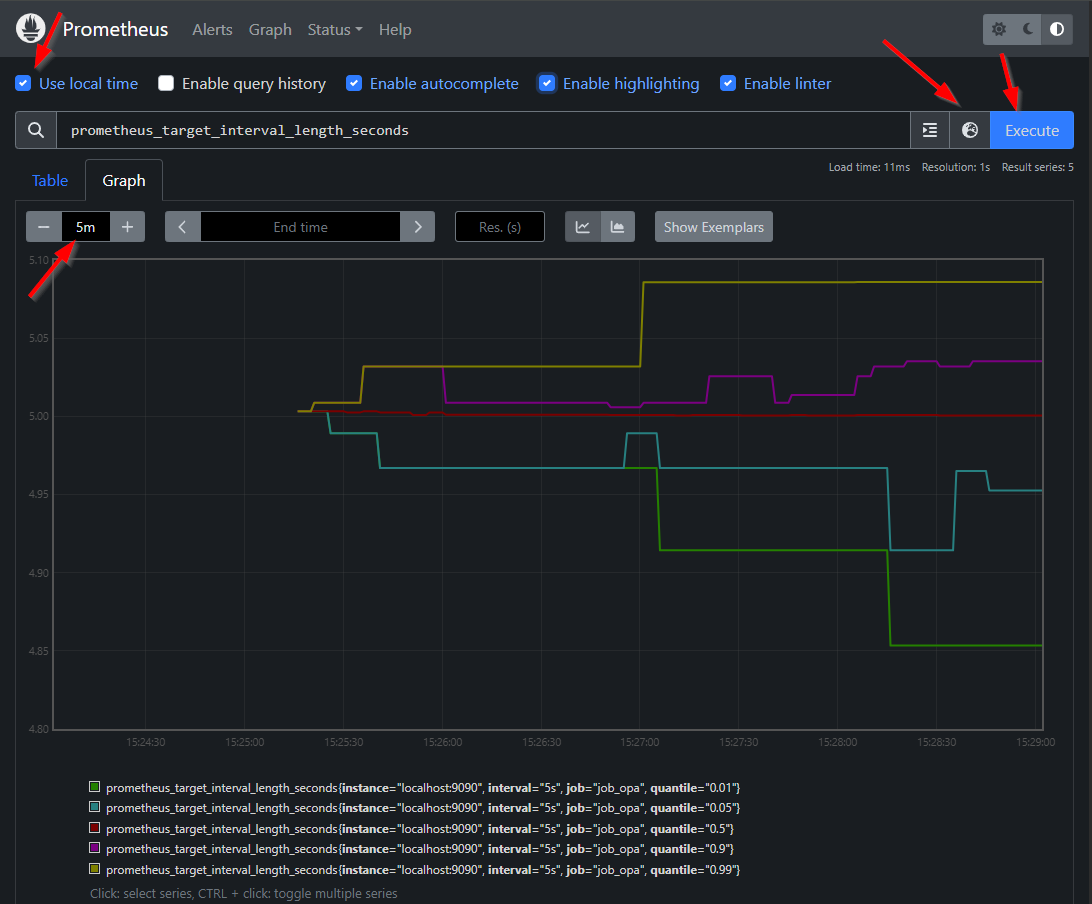
You can continue exploring on PromQL or play with more input like this:
prometheus_target_interval_length_seconds{instance="localhost:9090"}
All nice and great, but the great power of Prometheus are “Exporters” where we are interested in the JSON exporter to read the data from our valuable platform behind this health check URL http://192.168.56.107:8080/home/system/app/mp/health/ready returning a result like this:
1 | { |
For you good to know and for me a double-check, I shut down the service container
XFormsandNotificationin the ‘System Resource Manager’ from system organization where the overall status is"status": "DOWN"and this is the same for the two relative service containers!
Installing the JSON exporter
You can get it from here, and you can use the commands below to head start it all:
1 | wget https://github.com/prometheus-community/json_exporter/releases/download/v0.7.0/json_exporter-0.7.0.linux-amd64.tar.gz |
This is the starting input for the config file opa_config.yml
1 | modules: |
Now you can start “JSON exporter” (incl. the config file) with sudo /opt/json_exporter/json_exporter --config.file=/opt/json_exporter/opa_config.yml --log.level=debug and watch the log in the console! Open the UI from your browser at: http://192.168.56.107:7979
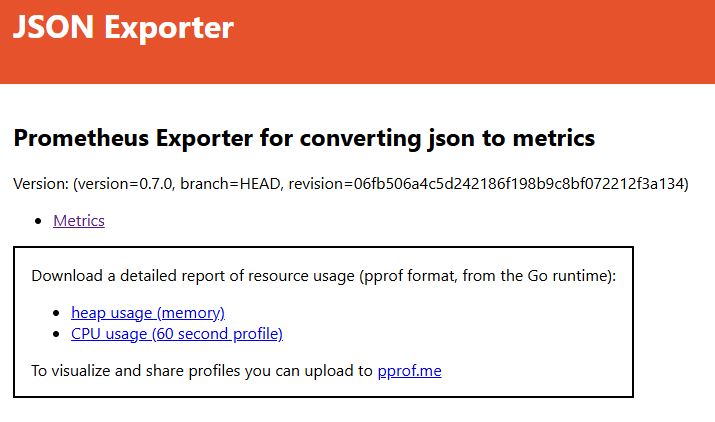
Great, but how can we verify things? Well, how about this URL http://192.168.56.107:7979/probe?module=default&target=http://192.168.56.107:8080/home/system/app/mp/health/ready showing this result (in Prometheus-formatted metrics!):
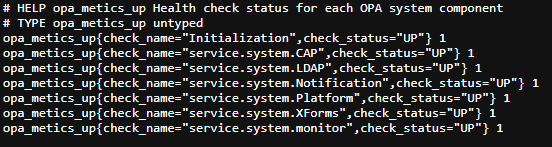
Great…time for the next step!
Get JSON exporter metrics in Prometheus
Stop your Prometheus instance with <Ctrl>+c and update the Prometheus config file via sudo vi /opt/prometheus/opa_config.yml with an additional job_opa scraper:
1 | global: |
Read about the
relabel_configshere or watch this YouTube video.
Start Prometheus again, and you can now “PromQL” on value opa_metics_up or do stuff like this:
opa_metics_up{check_name="Initialization",check_status="UP"}opa_metics_down{check_name="Initialization",check_status="DOWN"}sum(opa_metics_up{check_status="UP"})sum by(check_status) (opa_metics_up)
During typing notice the auto-completion…Nice!!
…
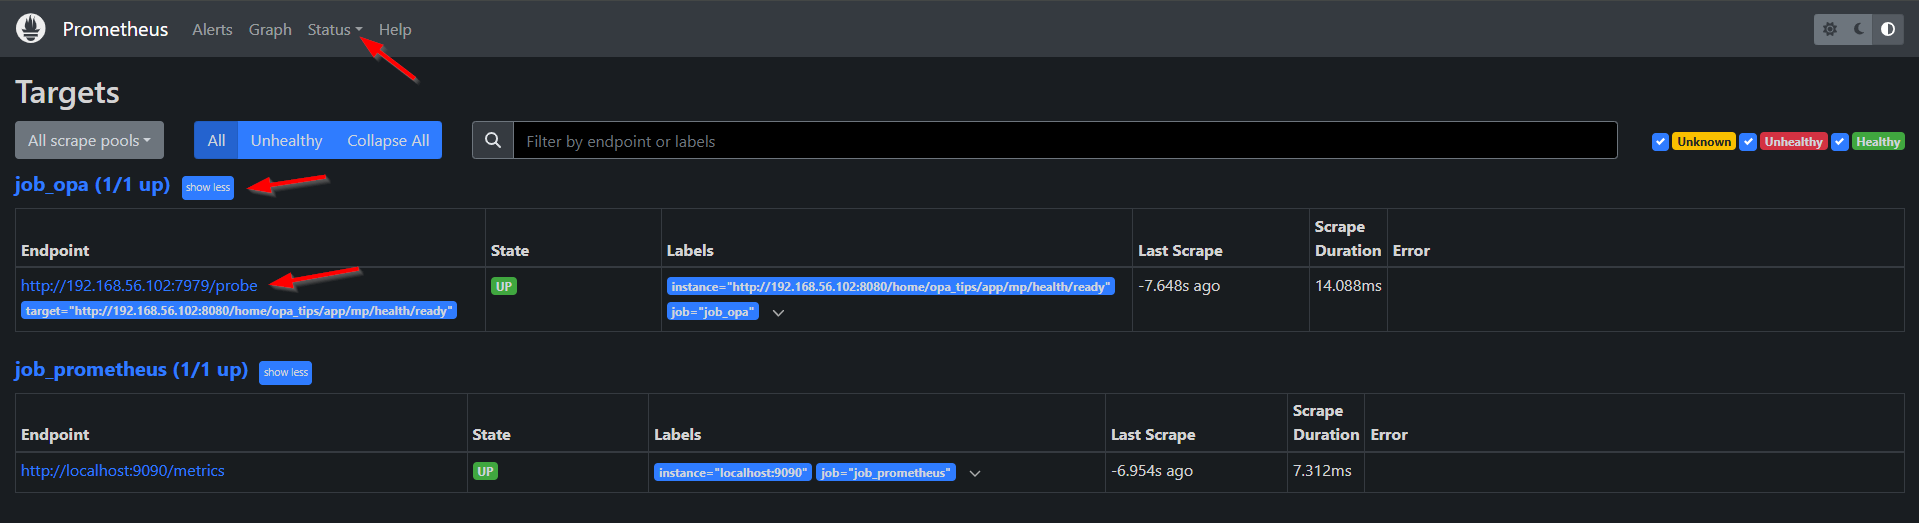
Interesting is also the “Targets” page for Prometheus where you see your hard work passing by:
Looks like we’re ready to further enhance the Grafana dashboards, but that’s a topic I leave for next week!
I give it a fascinating DONE for this first glimpse on Grafana. I thought it was more complex, but it was manageable; However, you can make it complex as you like with all the YAML configuration files. Simply ask the help of ChatGPT on this YAML-party and you should be fine with some logic thinking yourself. How hard can it be if I can do it too!? Let me know your experiences and what you think in the comments below. I learned a lot again, but it’s now also time for a great weekend with family and kids…Cheers!
Don’t forget to subscribe to get updates on the activities happening on this site. Have you noticed the quiz where you find out if you are also “The Process Automation guy”?
