
Hi there AppWorks fans,
Welcome to a new installment of AppWorks tips.
When it comes to speed, doing things simultaneous, multithreading, and firing activities in parallel is your way to go (I guess!?). It should (you read it correctly!) increase your speed and that’s also exactly what I placebo’ed (?) once someone showed me an interesting BPM that I (from that moment) will never forget; If I will use it in my implementations will depend on the outcome in this post. Be amazed…As always!
Let’s get right into it…
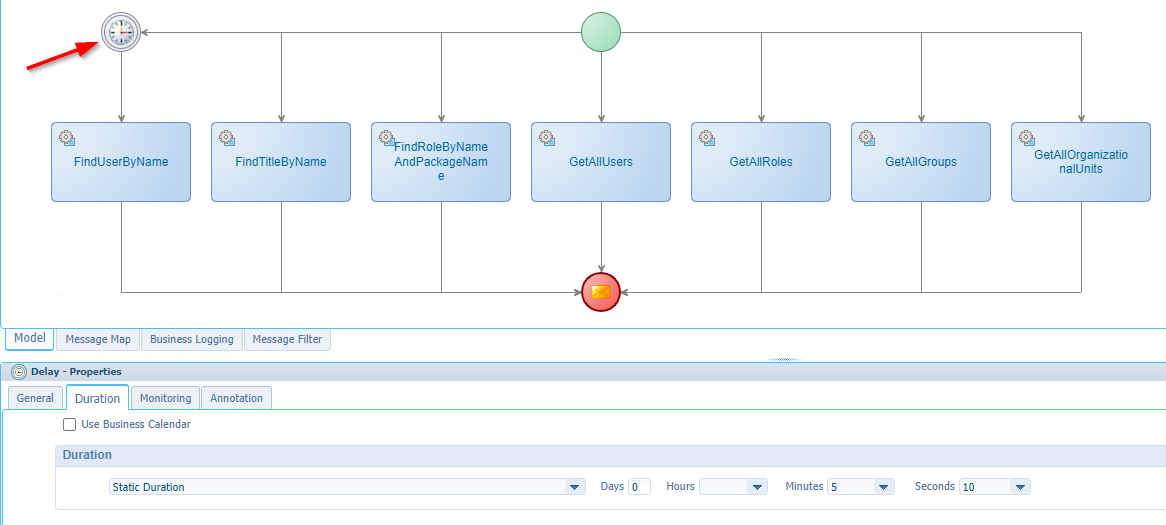
What am I talking about in the introduction? Well, let’s face a simple BPM (bpm_get_data) like this:
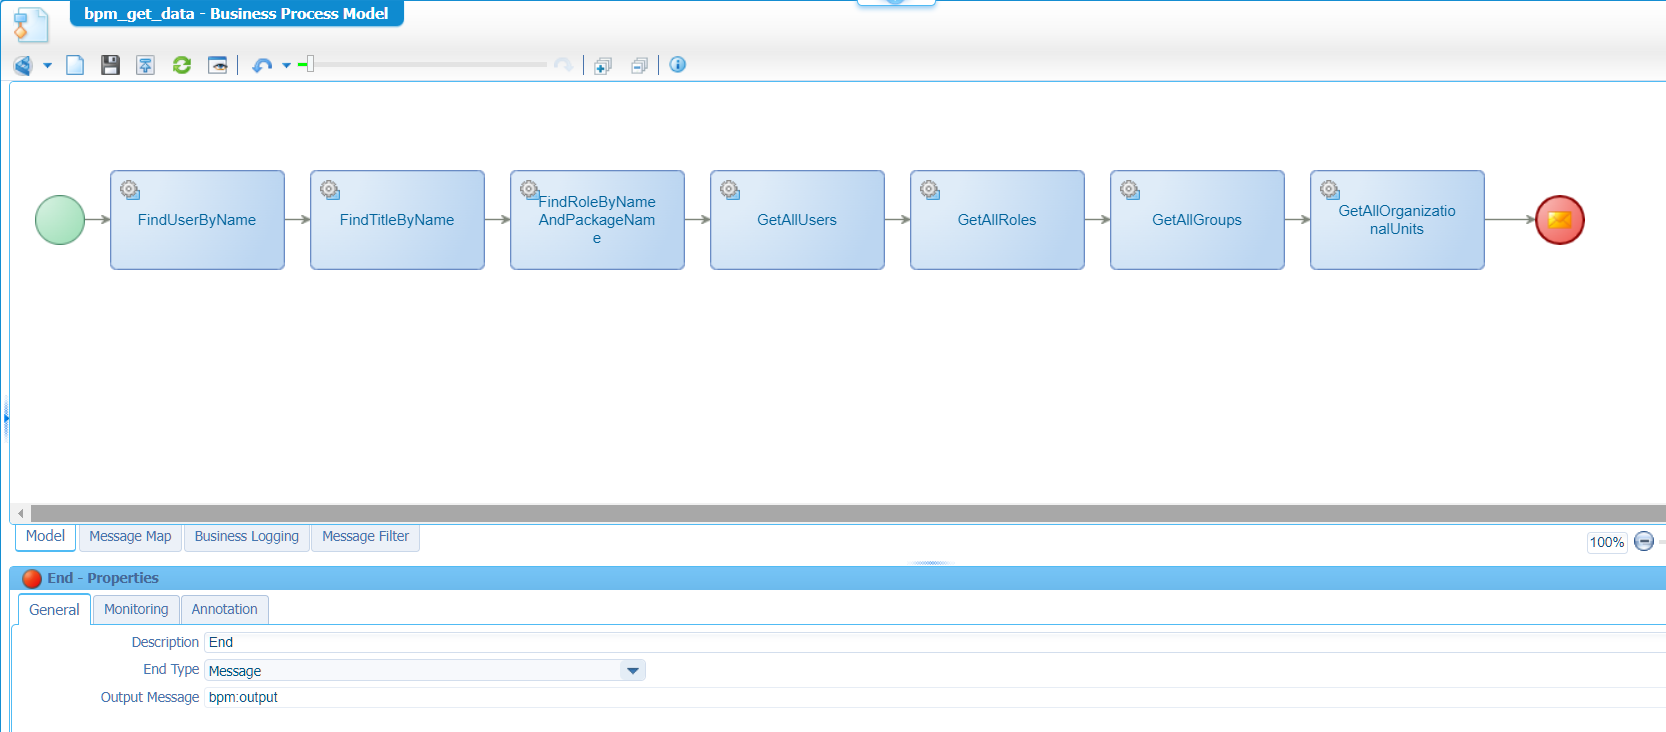
Pretty straight forward…right? Nicely placing all activity in a sequential flow after each other (I only used default webservices already available from the platform); like firing away against the platform. A highly common BPM which I see in each project. If it’s working, it’s working…This is the consolidated view of the configured messagemap:
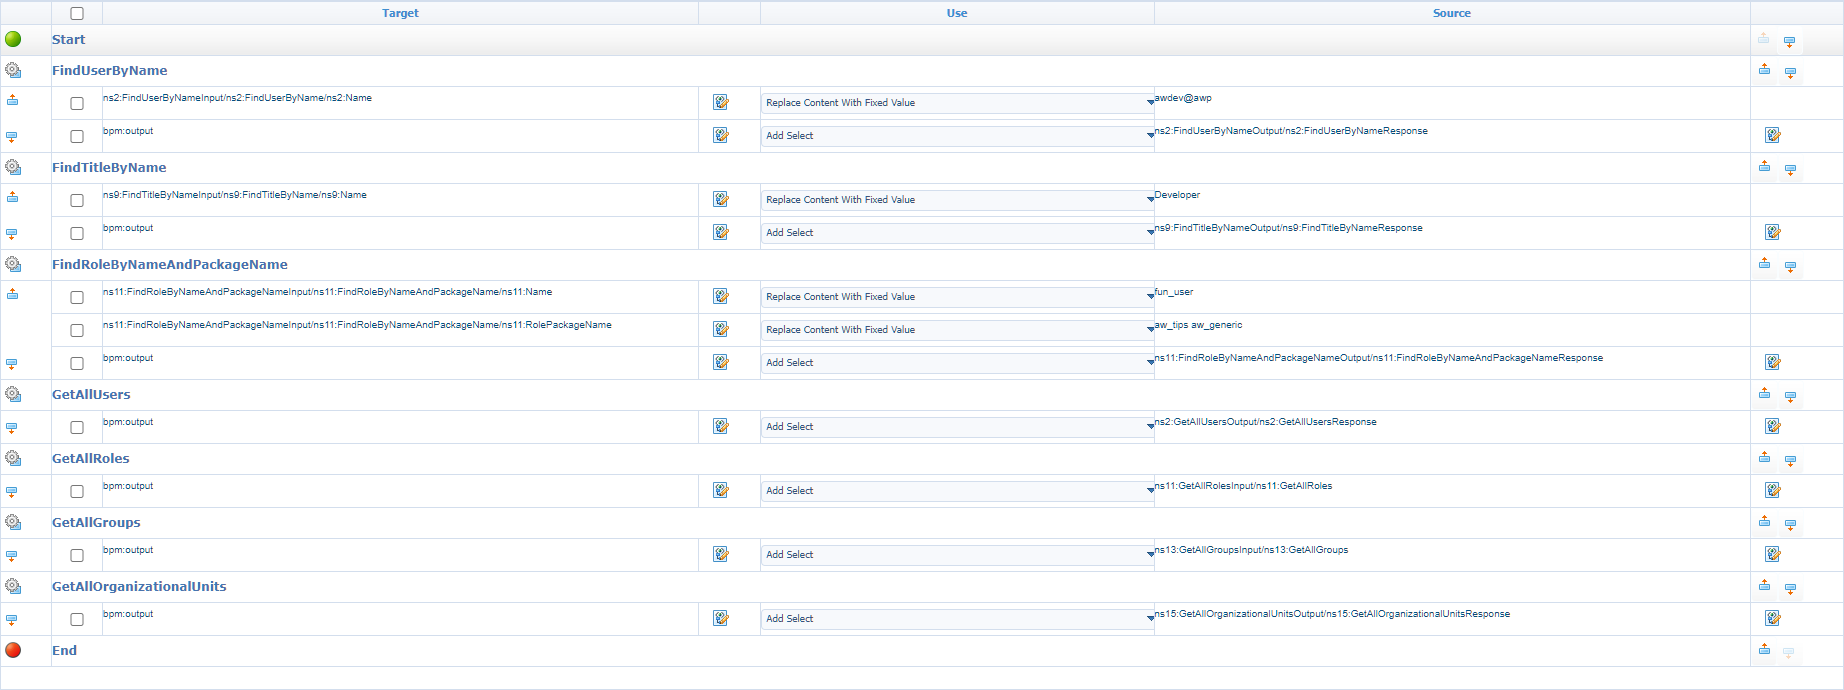
In the “post”-assignment in the mapping for each service call, I make sure to add the result to the output message…Just because we can!
…
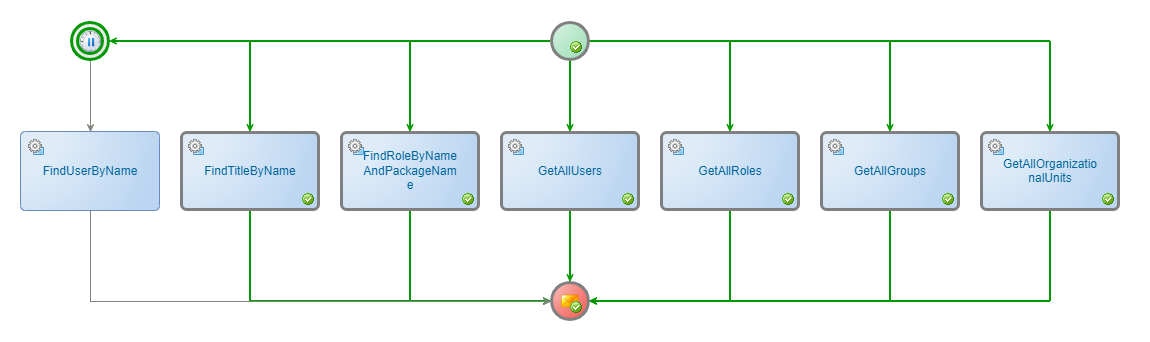
Now, let’s have a second thought and create a same kind of BPM (bpm_get_data_parallel) in a flow like this (I did a “save as” on the previous BPM and changed only the flows):
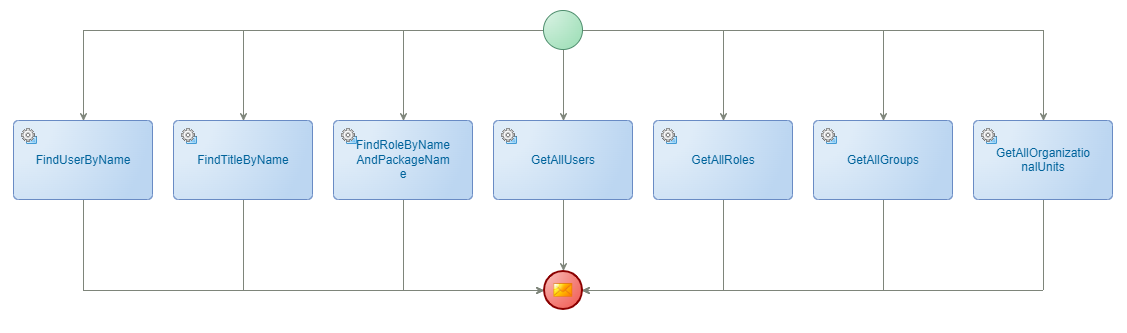
For your information; Both BPMs are equal in longevity type (which is long-lived).
What will be de difference in time running both types of BPMs…For this we start both BPMs (each 10x) and we have a view in the PIM artifact:
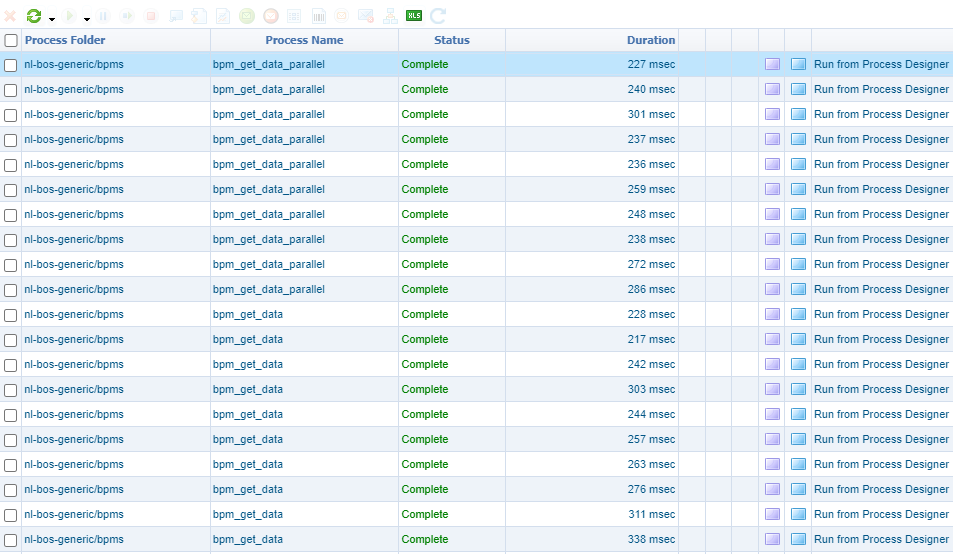
The average result?
- Sequential: 268 msec
- Parallel: 254 msec
That’s interesting! It isn’t that much of a difference after all!
Now for a real test
For this we open the ‘Test Web Gateway’ artifact which we can configure with a test like this:
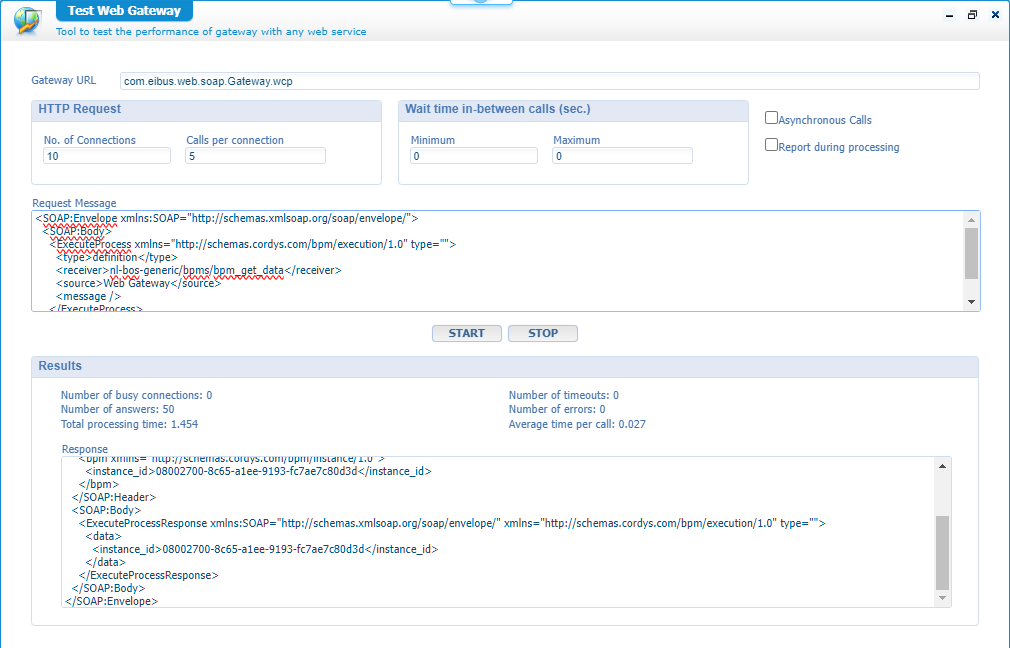
This is the XML request:
1 | <SOAP:Envelope xmlns:SOAP="http://schemas.xmlsoap.org/soap/envelope/"> |
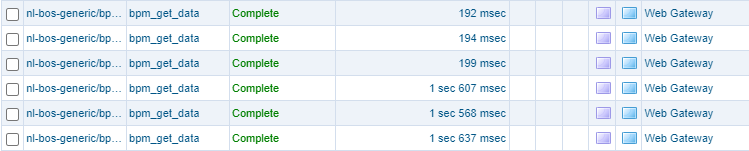
The result? Interesting again…The total processing time for both is almost equal; Around 1,5 sec! But this is just a service trigger…How about the PIM? Well, again amazing and unexpected…Most BPMs instances also have a duration around 1,5 sec!?…So, calling our BPMs over an ‘ExecuteProcess’ over this test artifact makes it slower!? Do you want to be more amazed? When I run the ‘ExecuteProcess’ directly via the ‘Web Service Interface Explorer’ (as a test-request), the BPM instances all run within 200 msec…WHAT??
Strange, as all instances are of the same type ‘Web Gateway’
I don’t know what else to try; It seems like parallel processing in this case isn’t the holy grail here. Do I need to think bigger in data here? More processing? Please, let me know in the comments…
After a high-valuable drink…
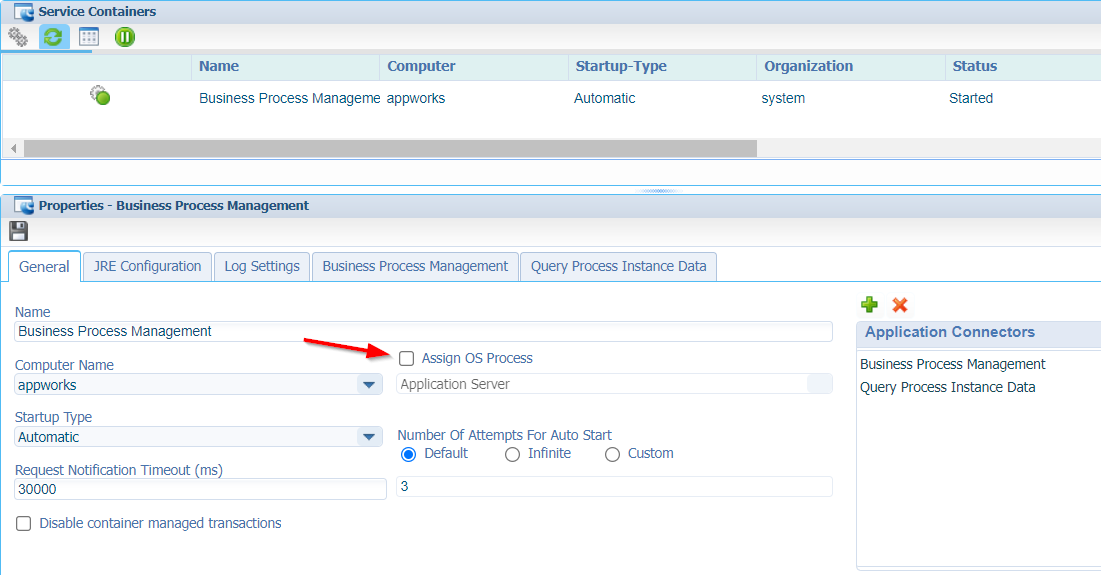
…with other AppWorks minded people, I was suggested to follow a different route! It looks like TomEE is the bottleneck here; Especially the service container responsible managing the ‘ExecuteProcess’ request…Which (recommended by OpenText for all service containers) runs under the central OS process (our TomEE!)
Why do you want all service containers to run under the OS process? Well, I’m no expert on this specific level, but it has to do with transaction management. Entity modelling uses different building blocks that will use different services of the platform. If all services run in their own JVM (which happens when you detach from the OS process!), you also introduce different threads which makes entity modelling more error-prone during commitment over a transaction. It’s a love-hate relation; Have a read here and here for more background information.
So, what would speed up things here? That’s figuring out what service container is responsible from the ‘ExecuteProcess’ request, detach it, so it runs in its own JVM, and try again! Now were talking techie-stuff again! 🤓
…
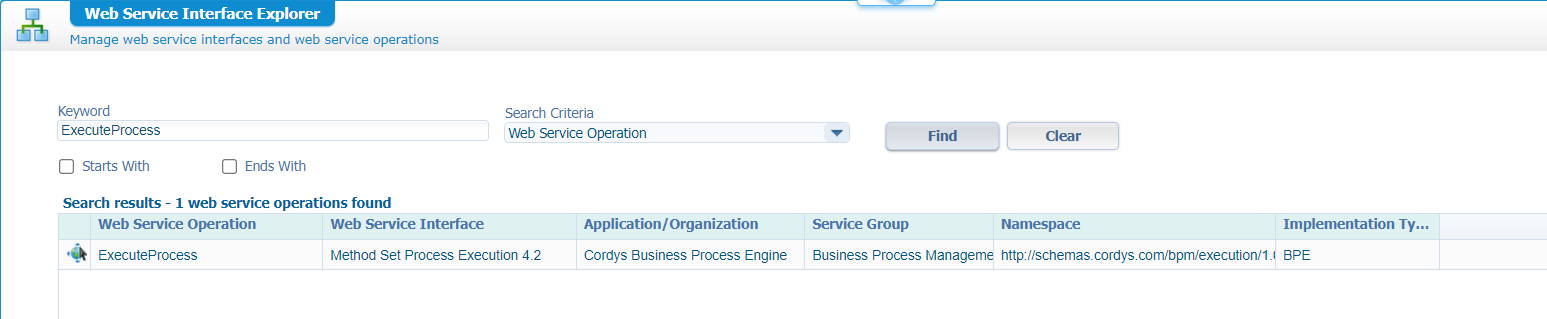
‘ExecuteProcess’ falls under the web-interface ‘Method Set Process Execution 4.2’:
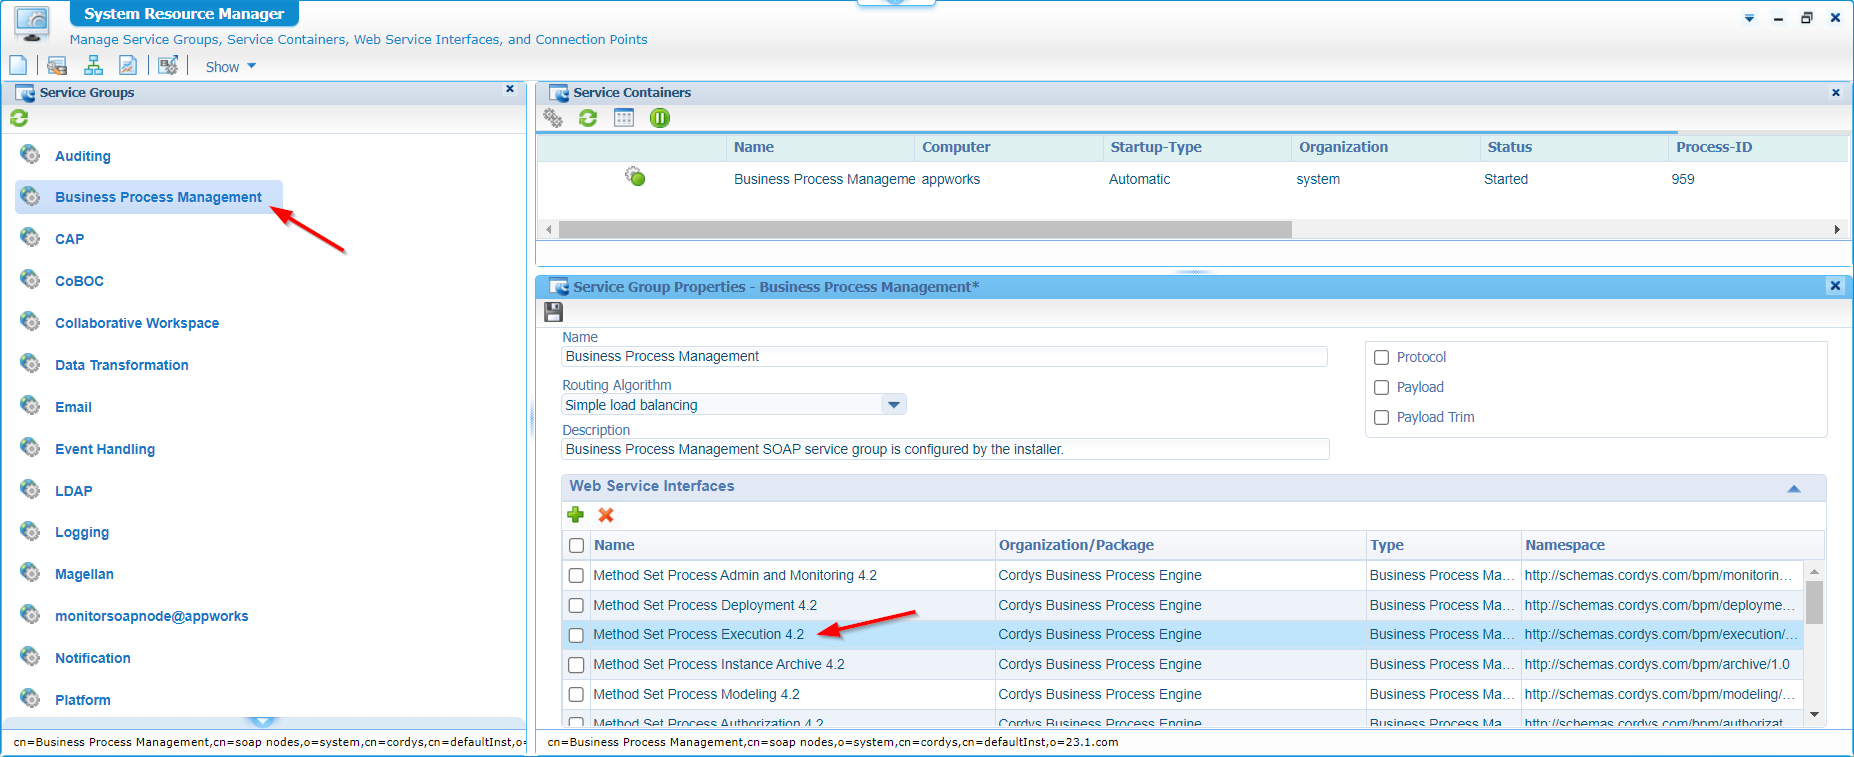
We know that each interface is managed by a specific service group (from a ‘System Resource Manager’ artifact perspective); Because I don’t have any in my own organization, I quickly move into the ‘/system’ space for a view like this:
Now, get the properties of the service container itself and detach it from the OS (like in the good old days!):
Save it, restart the service container and I also have a look on the server with command: ps -aux | grep java. It exposes a new JVM instance like this:
1 | /usr/lib/jvm/java-17-openjdk-17.0.6.0.10-3.el8_7.x86_64/bin/java |
INTERESTING…Time for that test! 10x each…
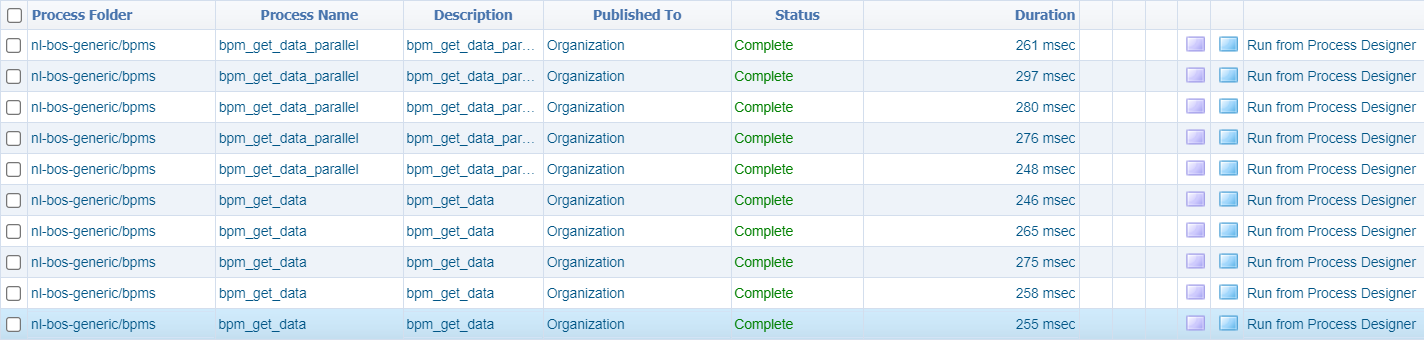
Well, I don’t know how it’s for you, but that’s NO improvement at all! 😣
Disadvantages
Let’s have a view at the other side of the medal…
Normally you want to reuse the output from a previous service call as input for the current call…To get related entity instance information for example. In the parallel flow this isn’t possible as you don’t have a previous to refer to! A big disadvantage as I see it.
What if one flow in parallel stops/halts?…Like this:
Well, have a run and a check in the PIM:
I’ll be damned…I already have an output message available!?!?
…5 min. and 10 sec. later…
I’ll be damned again…The output message gets an update with the missing parts! This smells to me a bit unreliable; I would not know any use-case that will benefit from it. I’m open for suggestions…Please, comment me!
A final setting on webservice performance
In case you didn’t know already. If a webservice activity (like our example activities) takes too long to response, you can tweak your activity a little with options like ‘Perform other tasks simultaneously’ or ‘Use reliable messaging’. Have a search for these terms in the documentation…
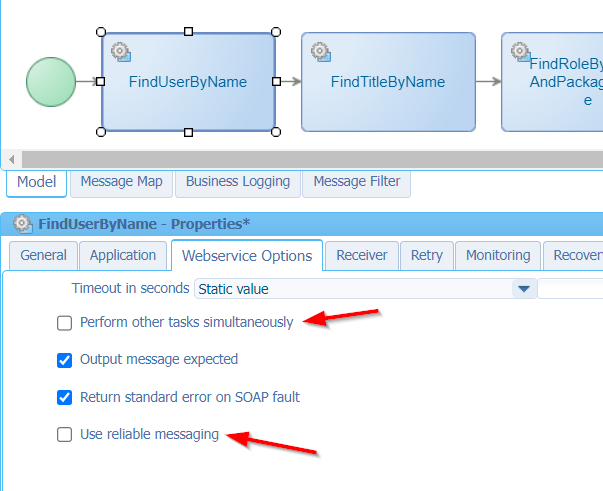
I tried it out…Guess what!? No drastic improvements at all, but my webservice performs already well enough! 🙄
…
I also tried the option ‘Disable container managed transactions’ on the service container…
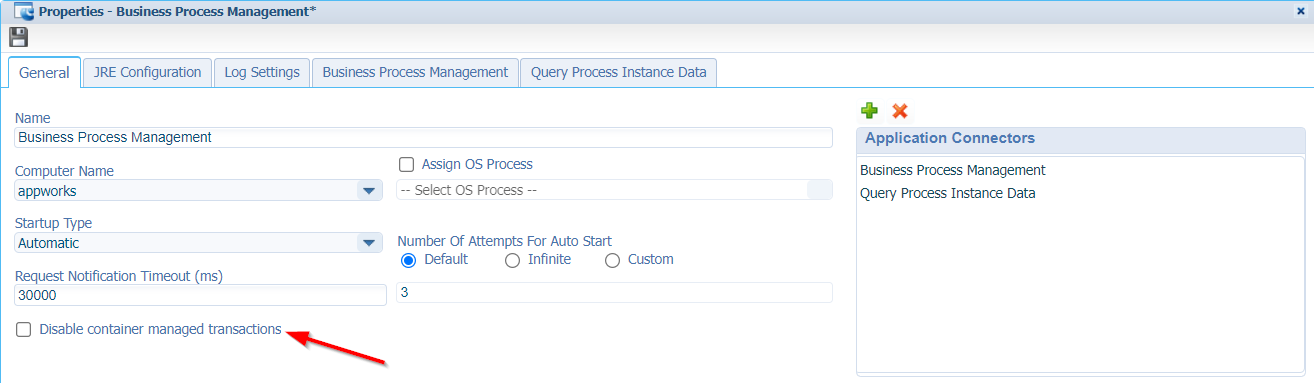
…It didn’t change anything!
Also, don’t do this stuff in real life; consult the professional services (PS) team at OpenText for further advise!
I had a totally different outcome for this post…It’s still a “DONE” for me, but with an after-taste that running activities in parallel are still not me first implementation choice! After some #SUPPORT I can conclude that “running activities in parallel” fell off the wagon once the platform moved to a full TomEE experience (the why!? is already explained in this post). It’s also in the backlog of the product team to solve it somewhere in the future; In the meantime, I stick with my sequential implementations which are equal in speed and also have all the benefits of previous activity input. Let’s see what the future will bring in improvement; For now, a great weekend to further explore. You can always comment me if I have overlooked something here. Cheers!
Don’t forget to subscribe to get updates on the activities happening on this site. Have you noticed the quiz where you find out if you are also “The AppWorks guy”?
