
Hi there AppWorks fans,
Welcome to a new installment of AppWorks tips.
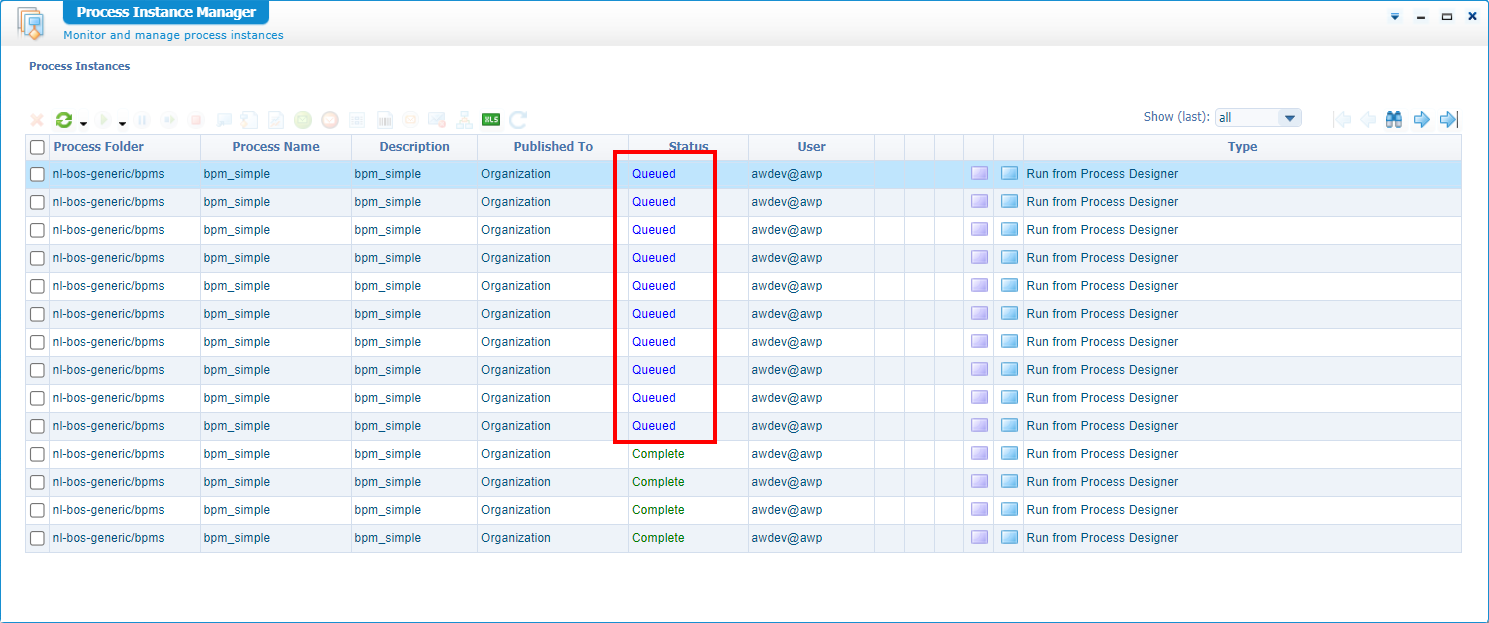
I saw it three times already in different projects and at each project I hear the same question over and over again…What is going on here!? What am I talking about? Well, this image:
Recognizable? Keep on reading this simple post…
The image shows the ‘All Instances View’; You can change it in the top-right-small-arrowed-down icon.
Let’s get right into it…
Your first reaction to that image would be…
- What is going on?
- Why are the BPMs in queued state?
- What could have caused this all?
All valid questions! In the meantime, your end-users are complaining things are not processed, your manager feels that things get out of hand, and your phone is red-hot from all the negative calls. It’s time for action…
First things first…boot your platform, open your AppWorks favorite URL and login with your developer account. In your workspace and related project, we create a basic 1-activity BPM (saved in the bpms folder of the project). Name it whatever you want; Mine is bpm_simple with a start- and end-construct for correct publication.
Once ready and published, you can start it a couple of times…With <F12>, from the right-click context menu in the BPM editor, or from the context menu on the BPM in your project…Whatever you want! Watch the ‘Process Instance Manager’ artifact on those ‘Completed’ items.
❗❗
Imagine that all of a sudden, you start to see those ‘Queued’ states in your PIM while (in your opinion) nothing has changed!? WHAT? Yes, you get the screen from above.
I know…You can’t mimic it right now, but you’ll learn…keep on reading…
❗❗
From the PIM artifact, you can mark one of the ‘Queued’ BPM instances and click on the buttons:
- “Show Graphical View” will give an error ‘Cannot trace the path, because the process instance data is not available’; This is the same error you get when you do have a completed instance, but all monitoring is disabled (like in a short-lived process!)
- “Show/Edit Message Map” will not show any error, but does show the initial instance properties for a regular BPM; So, we have a valid instance running, but it’s not processed (yet!)
- “Show Input Message” will even show your input message, if you have applied one to your BPM
- You can ‘Suspend’ and ‘Resume’ the BPM instance, but the result is the same
- You can hit the ‘Restart all’ button, but that only applies for aborted BPM instances…
So, what could be the root cause here?
Well, BPMs like all other types of requests are eventually managed by our service containers; Let’s have a look with the ‘System Resource Manager’ artifact (in our own organization!)…
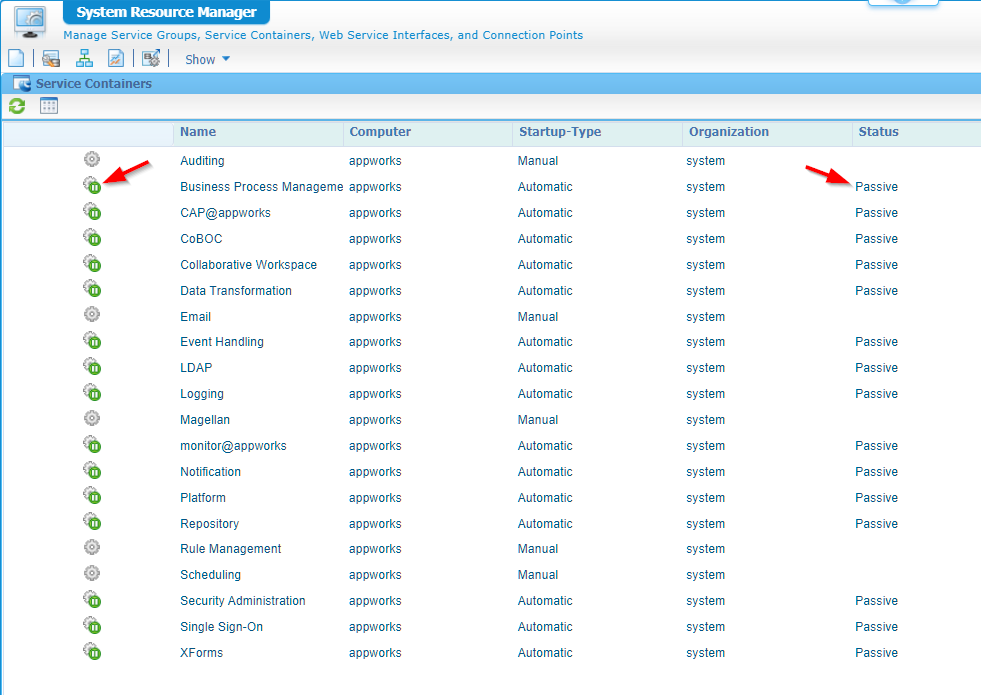
That’s exactly our problem…Our BPMs are just waiting to be processed by a ‘Paused’ service container! Interesting, also all the other service containers are in paused mode!?!? So, time to restart TomEE systemctl restart tomee on our server? Well, NOPE! They are still in ‘Paused’ state!? Now what? 😱
…
It’s time to grab your administrator helmet (including the sysadmin credentials), and move your ass into the shared space http://192.168.56.107:8080/home/system. Login, open the ‘System Resource Manager’ again, and hit the button that rules them all:
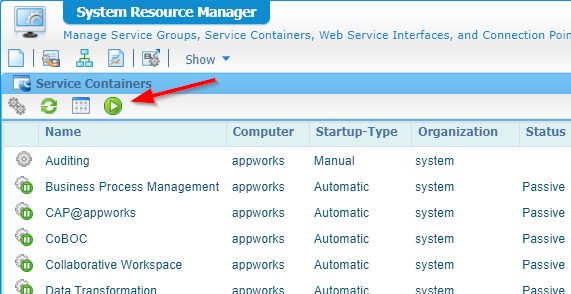
Ohw yeah! That’s exactly why you want to buy your administrator a beer and keep him/her as a friend! 😎
EXTRA NOTE: After an upgrade of our beloved platform the service containers are ALWAYS in the ‘Paused’ mode! It’s a post-task to start them again from this shared ‘system’ space!!
Prevention is key
Most of the time I see and hear this situation being detected after some time…When it’s already too late! How can this happen? Well, this all has to do with maintaining and monitoring your system. As an administrator you are the “spider in the web” and responsible for a stable environment to your end-users.
This is a list of common things I see going wrong over and over again:
- Missing daily checks by an administrator; Just checking if things look fine…Like:
- Service container in paused state! 🙃
- Running OS services
- Server overall performance
- Disk spaces and memory consumption
- Errors in log files
- Communication between servers; It’s not the first time a firewall is raised all of a sudden!
- Virus scanners highly active during peak hours
- OS patches being installed without verification of the maintenance team (initiated from higher hand)
- This most of the time triggers an OS restart without proper shutdown of related services; CARS is very picky on this!
- Java version upgrades not in-line anymore with the platform release notes; I see this also for web-browser versions…
- Database tuning on wrong tables without involving a real expert
- Calling platform webservices (from an external application) every second without communicating if we can do things different
- Not archiving anything (like audit-trail, PIM/CIM instance data!)
- Not monitoring the PIM/CIM on failed instances (our BPMs and entity lifecycles)
The list can go on and on; Comment me if I miss a high priority topic…
That’s a “DONE” for our post where we see the power of an especially important button in the ‘System’ space. Now you also know; So, when you get those ‘Queued’ BPM instanced next time in your environment, you now know where to search for! Have a great exploring weekend and I will see you next week.
Don’t forget to subscribe to get updates on the activities happening on this site. Have you noticed the quiz where you find out if you are also “The AppWorks guy”?
