
Hi there AppWorks fans,
Welcome to a new installment of AppWorks tips.
And this time we’ll cover the debugging features of a BPM. Next to the monitoring this is also a great way to see what is happening in your process. Where monitoring helps you analyze the process after it’s completed in runtime state, debugging will help you monitoring the process model during creation state.
Let’s get right into it…
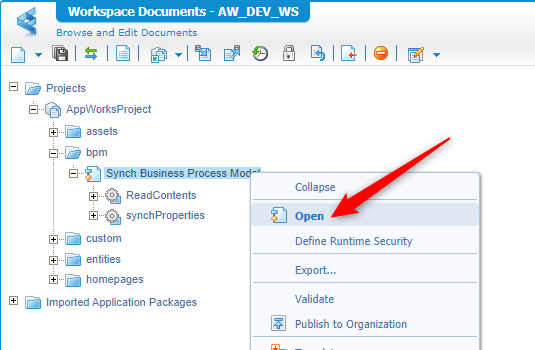
As always we spin up the environment where we can login with our developer role. Open our beloved workspace and corresponding project. It you followed all the posts on this site you should have a folder in your project with the name ‘bpm’. In this folder you probably also have a BPM document available like I have…Open it like a bro!
My BPM looks now like this and is triggered by a rule building block on the contents building block of my ‘Category’ entity
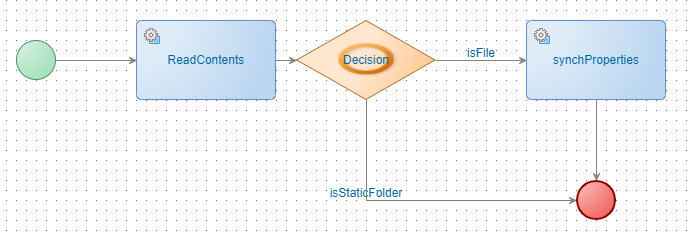
- ‘ReadContent’ calls the exposed ‘Read’ webservice from the Category contents entity. So, we get the information from the ‘current’ instanced entity into our flow
- ‘Decision’ detects if you have a file of a folder (this is a choice done because we see the Default template folder also starts this flow.)
- ‘synchProperies’ is a custom generated webservice that synch data from AppWorks to Documentum. We played with it in a previous post…The good stuff!
But now for the debugging part.
Right-click on an empty space in the BPM and click on the ‘Debug’ action (also note the short-cut key)

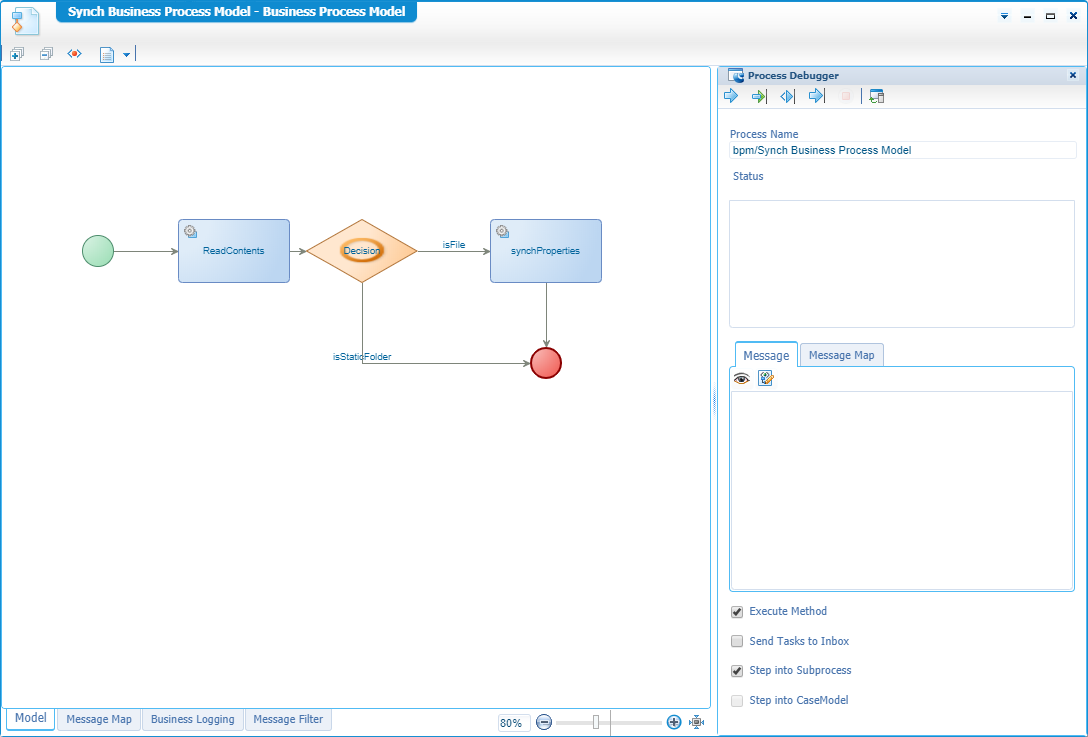
After this click you will see this screen popping up
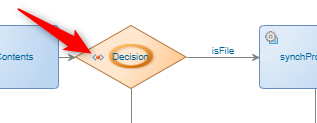
And if you might know with debugging you can also set the well-known ‘breakpoints’ on every activity in the BPM. You can do this by right-clicking the activity and select the corresponding action. You will be served with a notification icon.
Another possibility (if you have activities that call a service) is to test them directly from this screen. Just right-click one to open the test panel for that service. Not for now, but we’ll cover the service testing also from another post…It’s on the backlog!
Let’s start a debug session now…
Hit that ‘Step by Step’ button!

2 things you will see is after this action
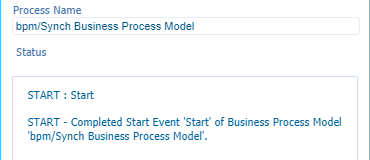
We get our first status message
![debug_007]()
Our ‘green’ initial start activity is getting a green Ok-mark
Nothing fancy you…now bit that button again.
Now we step into the ‘green’ start activity.
In our BPM this is valid as we want to retrieve the ID of the entity that started this flow because we want the get information from it to pass on through the flow. For a better understanding you can do a deeper dive in the message map
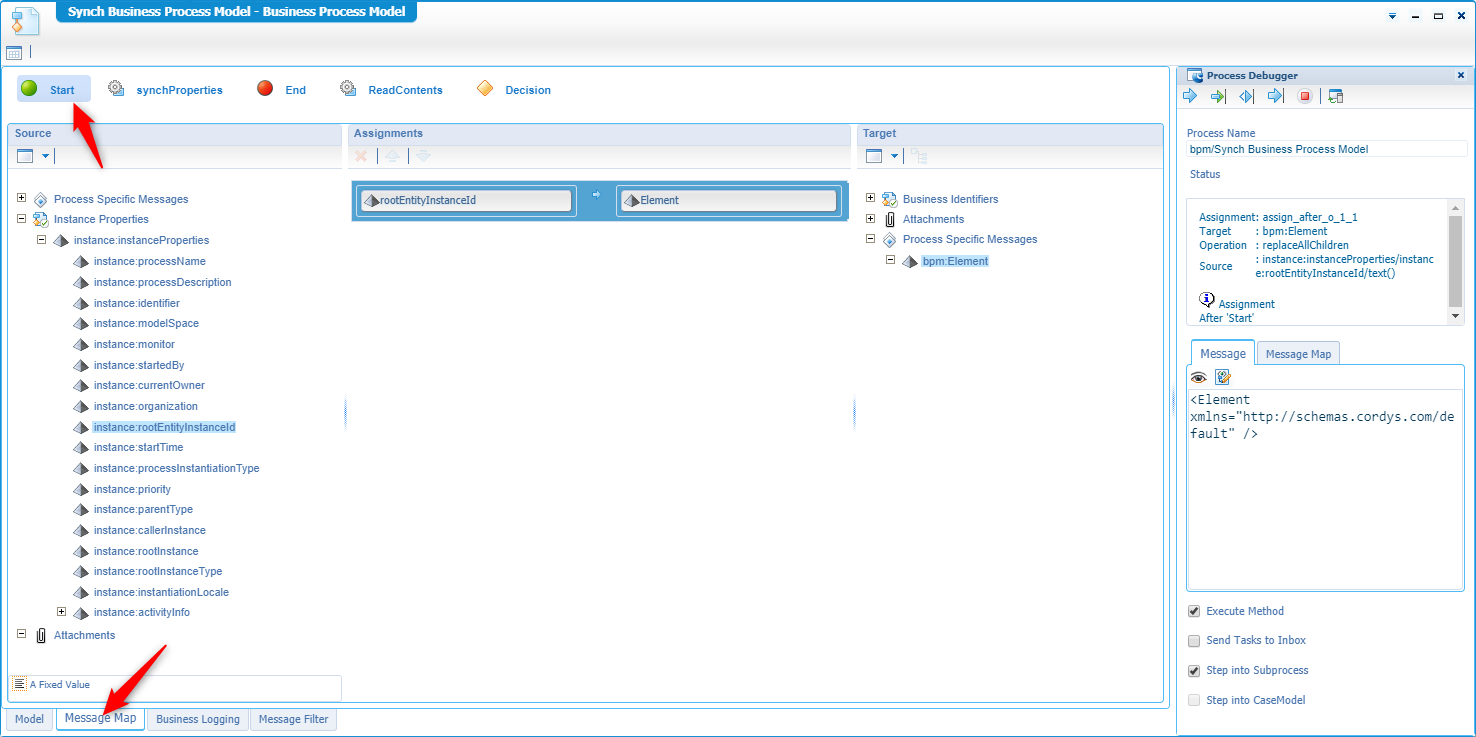
So, we pass the rootEntityInstanceId into the Element, but what do we see on the right side in our message…damn…an empty Elements tag!
And this is indeed correct because this time the flow is not started from an entity rule, but we started it ourselves with our debug action. Only the great thing about debugging is that we can manipulate stuff on the fly!
Click the small ‘eye’ and you are able the edit the message where we want to pass in a valid ID.

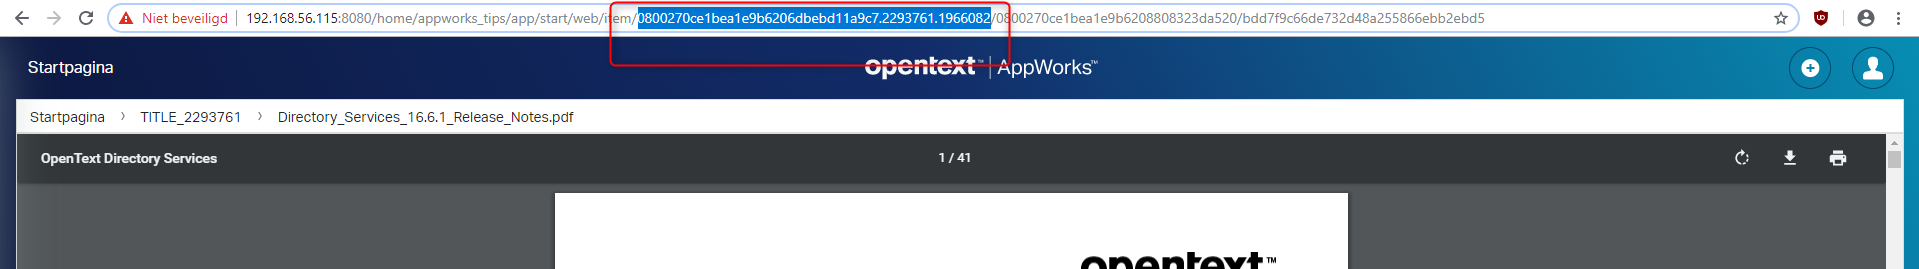
The element tag to use in this flow with the ItemID looks like this <Element xmlns="http://schemas.cordys.com/default">0800270ce1bea1e9b6206dbebd11a9c7.655361.327682</Element>
And where did I get the ItemID from? Look in the URL of you browser when you upload content (in the front-end /app/start) and after the upload ‘open’ the content for viewing you can see what you want to see.
After this ‘Message’ is updated hit the ‘Step by Step’ button again. We now go to the next step of the process. The ‘ReadContents’. In this activity we do 3 smaller steps:
- Get the last part of the above ItemID:
327682 - Get the whole ItemId from the ‘Element’
- Execute the ‘ReadContents’ webservice with the 2 extracted Id’s
Continue your stepping till the point where you get the result of a ‘Completed’ activity where you can also view the ‘Output message’ with the ‘eye’. Now you see where all that detailed information is retrieved from the previous posts…Nice stuff…right?…And you can even edit the output message…Hallelujah!

When you are ready, hit the ‘Run Till Breakpoint’ and you see the process continues till the ‘Decision’ activity.
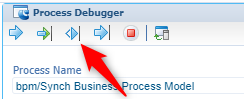
If all is fine the next button ‘Run Till End’ can also be executed. Or you can stop you debugging for now this the ‘red’ stop button.
My end-result looks like this where we can investigate all the messages passed through this flow.

And this end’s the debug session for this flow.
Maybe you saw these marks already:
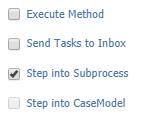
- ‘Execute Method’ does not really execute the method, so a webservice call will result in a ‘Default’ output message. Just try it out, but this makes sure things will not change by a method call.
- ‘Send Tasks to Inbox’ will send to task to the users inbox if applicable.
- ‘Step into Subprocess/CaseModel’ will only be done if any of those two are used in the process.
One last thought I didn’t try out!
Our ‘synchProperties’ activity is a generated service from a custom created library (a method written in Java). The library of this method is added to the class path of the WS-AppServer service container and this container is connected to the OS process ‘Application Server’. In theory this application server (should be our TomEE) can also run in debug mode and from our IDE (= tool to write Java) we should be able to remote debug our custom created code so we can also step through it in that way. This is something we’ll try in another post. I place it on the backlog…What a great thought!
There is our ‘DONE’ again. Great stuff to use while working on you process models and you want to have deep knowledge what is passed through in you nicely crafted BPM. Have a best day ever and I see U in the next post. Don’t forget to subscribe to get updates on the activities happening on this site.
