
Hi there AppWorks fans,
Welcome to a new installment of AppWorks tips.
A valid question in each project. How to set the monitoring on BPMs!? Well, I show you what I normally do (if that counts for a best practice) from a developer perspective and I will instruct you how to override things from an administrator perspective. It will for sure bring new insights again; Share it with others and comment me if other you think it can be better. I always want to chat about it; Just let me know…
Let get right into it…
Spin up that machine of yours and dive into your favorite AppWorks URL, with your favorite account, and favorite workspace (incl. that valuable project)! 😃
…
Ohw no…Wait, we’ll build a package and need to deploy it somewhere…So, let’s first move ourselves in the ‘/system’ shared space to create a new DEPLOY organization with the ‘sysadmin’ account; Make sure your administrator friends can join the party as well:

I use URL
http://192.168.56.107:8080/home/system?authID=Xto by-pass OTDS authentication here!
AND…now that we’re in the shared space, we also make sure the ‘Scheduling’ service container is up and running from the ‘System Resource Manager’ artifact; You can also make it start automatically! Why do we need this? Well, we need to start a BPM after deployment of our CAP file; From that point you cannot run it (easy) by right-clicking something and execute a BPM run; That’s why I use a schedule for it.
Of course, we can use the ‘ExecuteProcess’ service call to start it, but now you see a bit more of the platform as well. 🤣

…
With this DEPLOY organization in place, we go back into low-code mode. This means the regular URL http://192.168.56.107:8080/home/appworks_tips/ over OTDS authentication, with account ‘awdev’ (in my case), in your favorite spot. From the ‘Workspace Documents’ artifact, you create a new BPM:

Keep it simple with just one activity between the start- and end constructs (see below). Save it as bpm_dummy in the ‘bpms’ folder of the project.
Get into the properties of this new model and change the ‘Monitoring’ settings (for this by default ‘long-lived’ process!…Moving to ‘short-lived’ will change this for you!).

Recommendations on these settings as they depend on the type of flow and the default heaviness and importance for the solution:
- Never fully disable the monitoring on process level; The PIM is your friend when ^$@^% hits the fan…In that case you even want to know about the ‘Completed’ instances…trust me!
- Start with only ‘Process status’ for basic BPM and increase to ‘Store complete … when process aborts and basic … when completes’ for the more critical BPMs
- Optionally add the activity monitoring on critical BPMs only; I use mostly ‘Store complete activity info only when activity aborts’; It’s optional as below it’s quoted that the message map is far more important.
- Learn yourself to read message map data instead of using the “graphical view” in the PIM; This way you can stop saving the activity information in the monitoring.
- If you only use BPMs to manage advanced Rule building block logic (can also via long-lived processes, but is another discussion!), disable the ‘Enable Crash Recovery’ (in the ‘general’ tab) and ‘Store Recovery Data’; This saves space and increases performance. Use it wisely and be smart!
- Leave ‘Default Settings for all Activities’ enabled…Don’t mess with separate monitoring settings per activity! You’ll get crazy over time (or you really have your reasons)
- Be incredibly careful with the selection that have the message-map option in it! They will have a direct impact on BPM performance; especially with large message map XML parts!
- Always check your monitoring on BPM in development; You’ll not be the first one doing a commit into source control with a fully enabled monitoring setting…This is also not needed in DEV; Continue your read below on this mindset.
- Read the documentation (#RTFM) on these settings! Section ‘Business process model properties interface’ of the advanced development manual.
…
Next, we create a ‘Schedule’ type of document; Use this screenshot as input and save it nicely in the ‘schedules’ folder of the project:
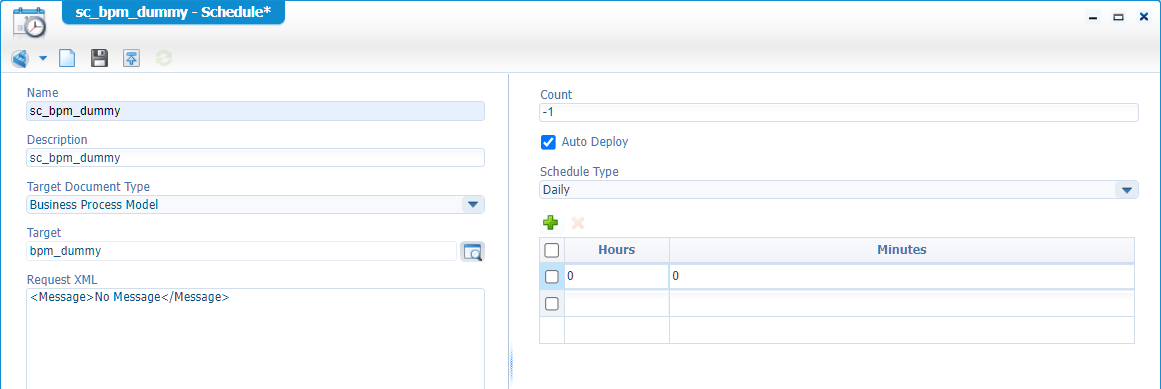
Notes:
…
Great, save it all, do a publication (to see if we’re publishable), and create a new package. For this we first get into the package properties:

The only thing I change is the supported deployment spaces (it’s just a habit):

Hit OK, right click again on the project to create a new package (version 1.0.0)…When generated, you can download it:

Deployment time
With our package ready, we move back into the ‘/system’ space where we can open the ‘Application Deployer’ artifact and do a first upload and deploy in our DEPLOY organization:

Just follow the wizard till you can safely deploy the CAP file:

In case you get signature error of unsigned packages, have a look in the ‘Security Administration’ artifact; Tab “Code Signing”!
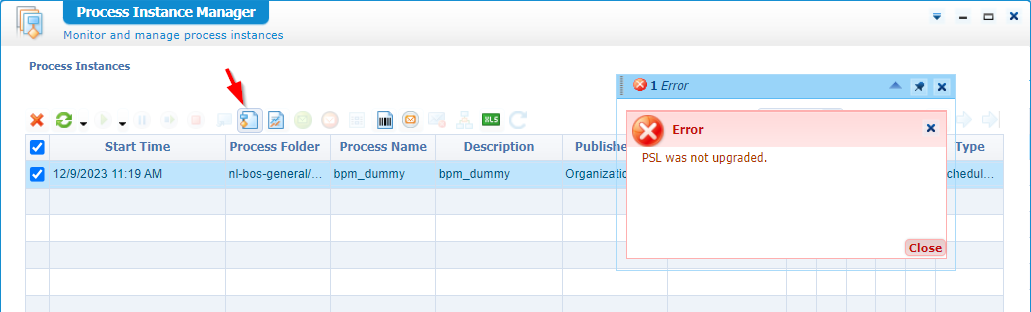
What just happened? Well, our package is deployed! Great, but something else needs to get a trigger as well. It’s called PSL data, and we’ll have a deeper dive on this next time; It all has to do with the “description” of our BPM.
If we don’t upgrade this PSL data, we see an error in the PIM like this when you want to see the ‘Graphical view’:
Open the ‘Deployed Process Models’ artifact in ‘/system’ (NOT from within your own organization!) and find yourself a secret hidden button:

Behind this button, we’ll see all the deployed packages with PSL data; Ready/Pending for an upgrade:
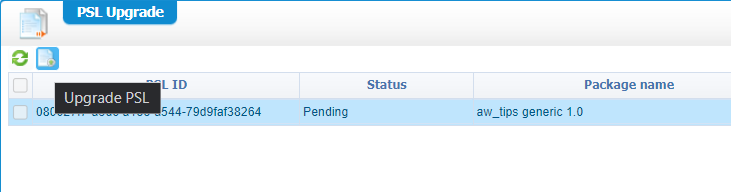
Hit it, and we’ll be fine from the PIM perspective; The rest I leave for next time…You’ll be amazed again on what is happening behind this stuff. Performance wise it’s better to not deploy it directly (nor even upgrade it)…WAIT; We’re getting off-track! NEXT TIME! 😶
…
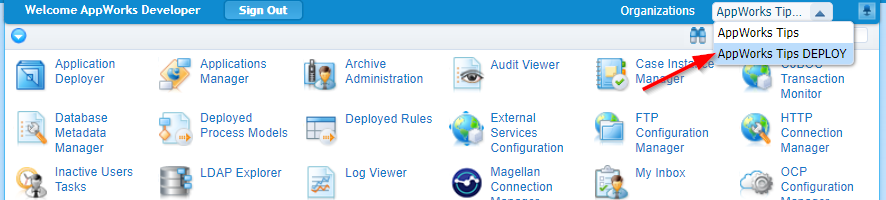
Let’s switch gears and move into the ‘DEPLOY’ organization:
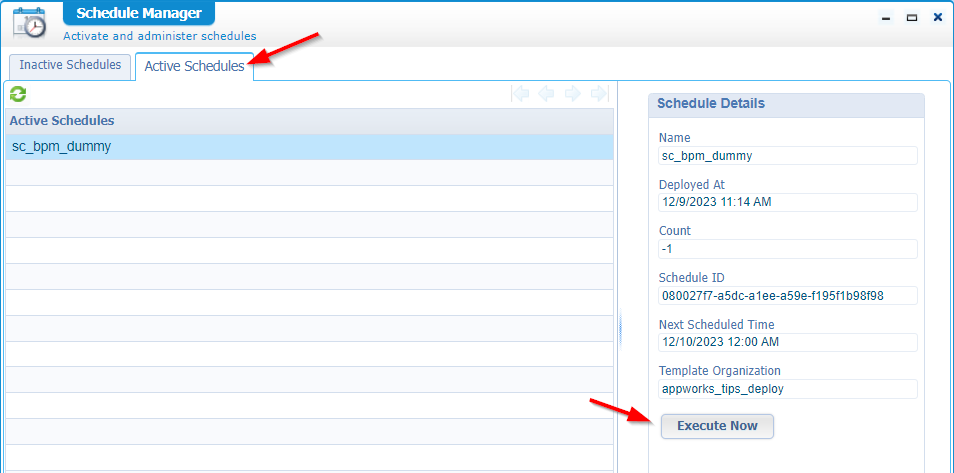
Don’t use the ‘Workspace Documents’ artifact here! We only have a CAP file deployment available in the space/organization. So, open the ‘Schedule Manager’, go to the ‘Active Schedules’ tab and execute our already deployed schedule:
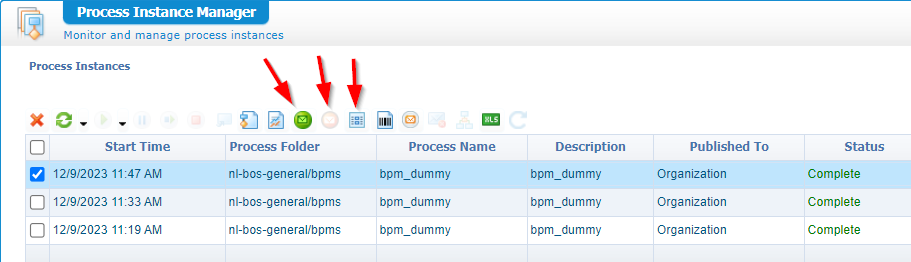
Guess what happened!? Well, move into the PIM artifact, select the BPM instance and have a graphical view:
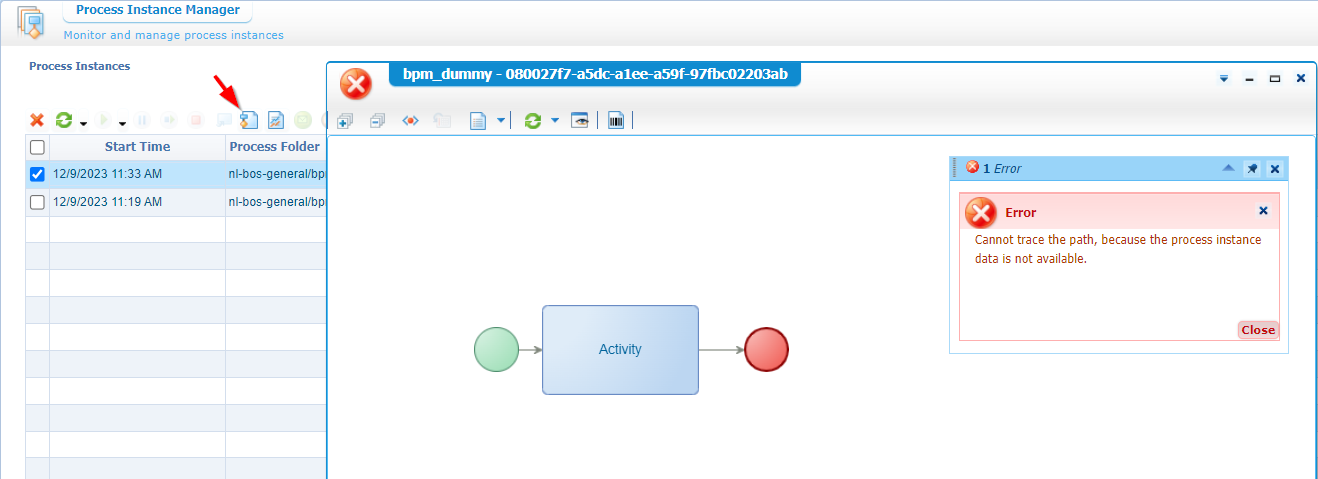
In the top right corner of the PIM you can switch from summarized view to that backend view from my screenshot!
Is this a valid error? Yes, it is…We’ve configured the monitoring to only show the ‘Process status’…remember? But now the great question…Let’s say we’re in production with a large BPM, but it hits the &^%#&^% fan; In that case you want to have a backup scenario to still have a deep dive.
I quote “large” BPM, but what is “large”? I always recommend to keep your BPMs small and let them do 1 thing only and make sure it does it very, very well. Like in programming; Where we have the Single Responsibility Principle (SRP) from the SOLID design principles!
…
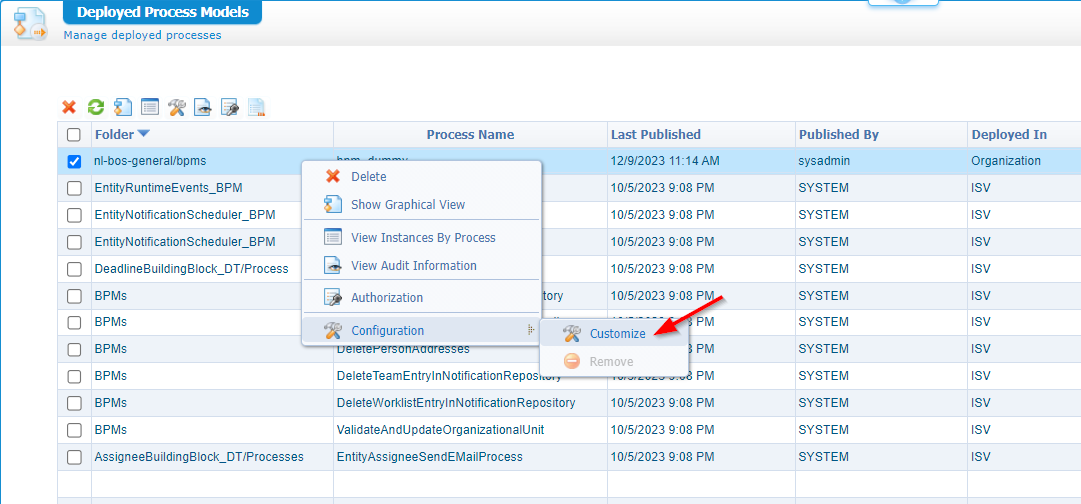
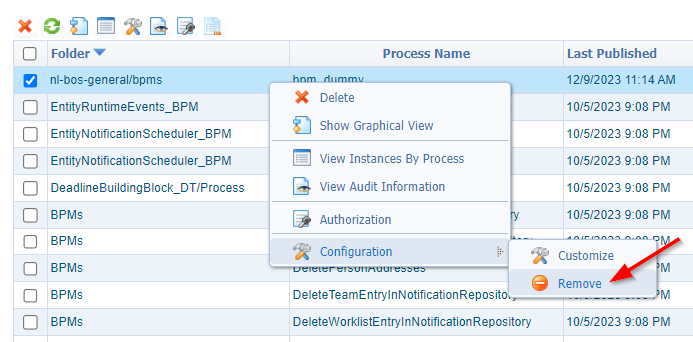
Imagine our DEPLOY space is indeed production…How to continue! Well, don’t go to your developers asking to raise the monitoring level on the BPM. Take your responsibility and open the artifact ‘Deployed Process Models’ (this time from your own organization!). Find the BPM, right-click it and click the ‘Customize’ action:
Guess what you can do here?
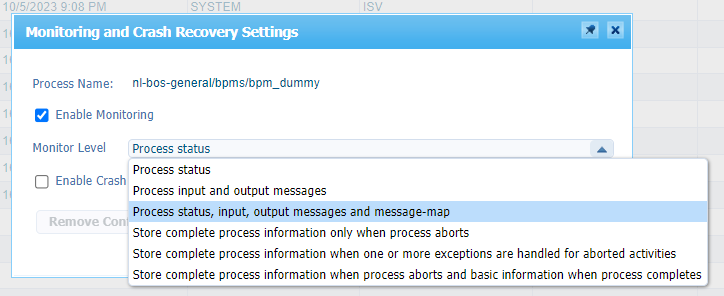
Set your level (and get a notion on the ‘custom’ setting), run that BPM again (via the scheduler), and have a second try in the PIM; Conclude that you still see the same for the graphical view, but what you DO see now is the message map, the input, and output (not in our case!) data:
Get familiar with this data/information as it will save your ass once BPMs start to fail in production!
AND…don’t forget to remove the ‘Customization’ once your analysis is DONE…Very, very important! You’ll not be the first one that leaves it, and everything starts being slow!
Q/A
Just some quickies on my own open questions:
- What about the failed BPMs? Reset the data that was changed and restart it. Again, a reason why your BPM should only do 1 thing and do it well!
- What if I want to have the graphical view also? Make sure to set the monitoring (for the BPM in DEV) on activity level as well. Start small with ‘Activity status’ only; Trust me, you don’t need it. The message map data is far more important! You can try this last setting yourself on the BPM monitoring settings tab; Create a new package
1.1.0out of it, deploy it again, and try it out…Eventually you’ll get a view like this:

There is my customized “DONE” where we explored an important maintenance task to monitor BPM instances. You now see that it’s possible to overrule the settings of a BPM once deployed in the production environment. With this I gave some recommendation to manage it all; Pick your own benefits from it. I see you next week on a new hot topic at AppWorks Tips. Have a great weekend.
Don’t forget to subscribe to get updates on the activities happening on this site. Have you noticed the quiz where you find out if you are also “The AppWorks guy”?
